As hard as it may be to imagine, the day is coming when utilities will start turning off the gas to our homes. Not right away, but certainly in the coming years. The reason is that we cannot keep burning gas in our buildings if we expect to meet our climate goals. Multiple studies have shown that the most cost-effective way to eliminate emissions from our homes is to electrify (1), and as we do that our utilities will disable parts of the gas system. The topic of this blog post is not when this is going to happen, but how this is going to happen. In particular, which homes do we pick first?
The “unmanaged” approach to decommissioning the gas system would be to let households electrify when they choose and then shut down each segment of the gas system when it’s not needed. That approach would leave the gas distribution system largely intact for a long time. The resulting high maintenance costs combined with low usage would cause gas rates to shoot up. In 2023, gas distribution costs in PG&E’s territory amounted to $510 per customer. Imagine how high they would get if usage drops off but infrastructure costs do not.

Gas distribution costs for various investor-owned utilities in California. Source: California Public Utilities Commission staff report, 2022.
If the households forced to pay those high rates are those who can least afford it (e.g., because they couldn’t afford to electrify their homes), then this is a serious equity issue. So the state has been looking at fairer ways to transition off of gas. (I love the phrase “mindful decommissioning”.) At the end of last year, the California Public Utilities Commission (CPUC) drafted a framework for thinking about the process.
They propose five tranches for decommissioning the gas system. The first and earliest tranche represents about 5% of customers in each utility’s base. It would consist of those sites that would benefit most from removing gas and that would find it relatively easy to do so. Areas with pipelines in need of repair could allocate some of the maintenance funds for electrification, making it more affordable. Areas with high levels of asthma and ozone might benefit most from improved air quality. Sites with local organizations that would champion this effort would streamline things. The earliest movers would have all of those characteristics. (2) The next tranche would be the 20% of homes who score next highest on these criteria. After the first 25% of buildings, the technology and skills needed to transition buildings away from gas will be more mainstream, and areas that were not as cost-effective in the early days can be pursued. This continues for five tranches, with the last one containing buildings that are difficult to electrify (e.g., industrial facilities) and/or that might be targets for hydrogen or biomethane.
What would this look like in practice? Do the economics make sense, even for the first set of buildings? A few years ago, the California Energy Commission asked GridWorks, Energy and Environmental Economics (E3), and Ava Community Energy (3) to answer that question in the context of the East Bay. Could they identify neighborhoods in the East Bay for early, proactive gas shut offs that made good economic sense while meeting the needs of the communities?
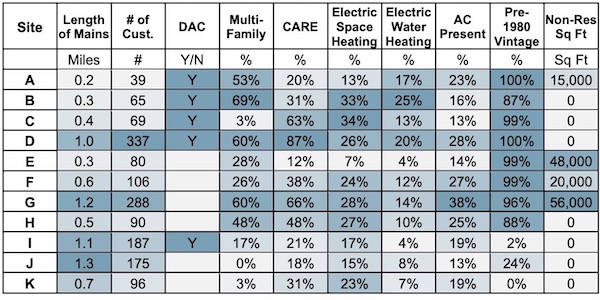
The basic idea was to prioritize shutting down gas on segments that would otherwise need expensive maintenance. In PG&E’s East Bay planning division, the costs of gas main and service replacement are about $4.72 million per mile of gas main, so there is substantial opportunity in avoiding these costs. The team looked at those segments that would need work in three or more years, and further refined the selection to those segments that could be safely shut off without disrupting the rest of the gas distribution network. They ended up with eleven different sites around the East Bay, as shown below. (4)
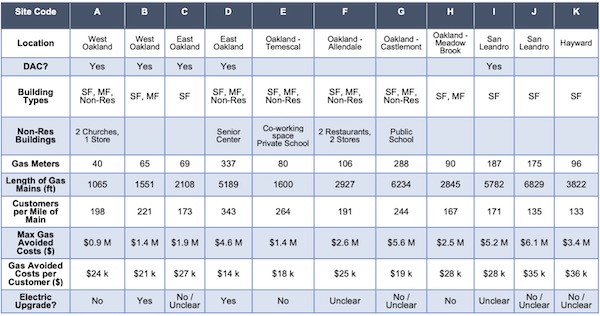
Key characteristics of the 11 candidate sites. Source: Gridworks blog post, 2023
Once these sites were selected, they did a “benefit-cost” study to look at the economic feasibility of turning off gas in each one. They evaluated a wide range of costs and benefits.
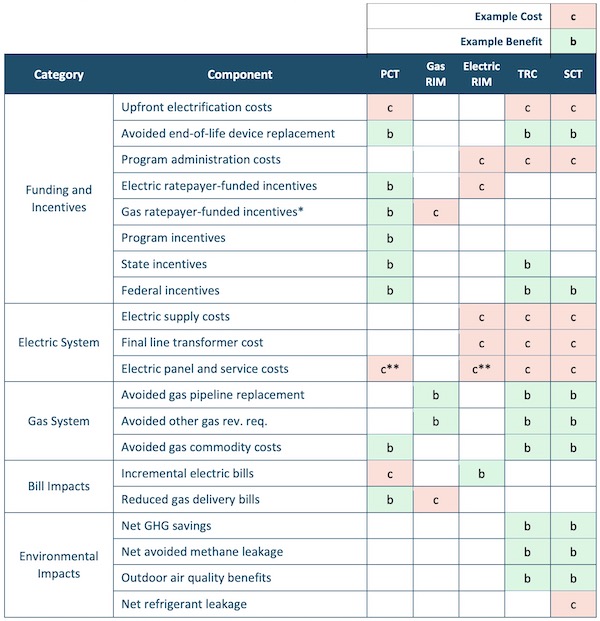
Types of costs and benefits for decommissioning gas to a site. Source: Energy and Environmental Economics report, 2023
The biggest sources of benefits were found to be the avoided pipeline maintenance, avoided end-of-life appliance replacement (new appliances replaced older ones), and greenhouse gas reductions. The biggest sources of costs were electrification and service and panel upgrades, as you might expect. It turns out that benefits exceeded costs for each one of the sites, but to varying degrees. (5)
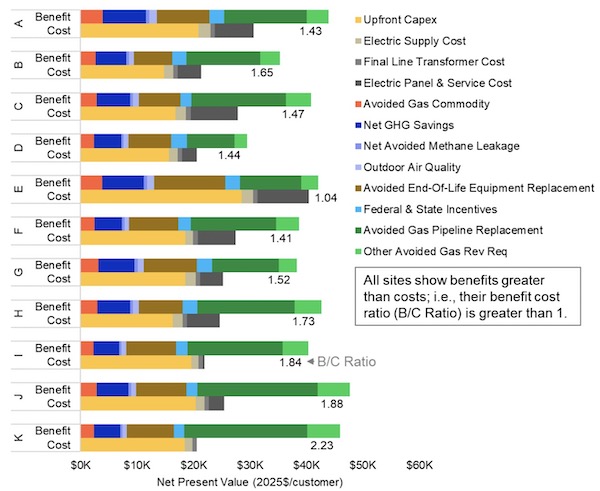
Benefits compared with costs for decommissioning gas at each of the eleven sites. Source: Energy and Environmental Economics report, 2023
One of the observations the team made early on was that since electrification costs are higher in denser areas (there are more households to retrofit), it is harder to offset those costs with avoided gas maintenance. In this case, sites C, I, J, and K are less dense. You can see in the table near the top of the post that the avoided costs per customer (second to last row) are higher in these areas. It’s a better deal to electrify these less dense areas. If the team prioritized sites based purely on what made the most economic sense, the areas with fewest buildings per mile of gas line, often wealthier areas, would win. Because they wanted an equitable approach, they did not prioritize savings per customer above all else.
The team also found that commercial sites can be considerably more expensive to electrify than residences. They believe this is due not only to size, but also to the fact that these buildings tend to vary a lot and be unique, so design and implementation are more complicated and require more expertise. Again, they did not choose to avoid these sites, preferring to opt for diversity.

Average upfront cost to fully electrify a customer, not including incentives or panel and service upgrade costs. Note that some customers were partially electrified to begin with, so the cost in those cases is for just the incremental work needed. Source: Energy and Environmental Economics report, 2023
So the overall system benefits look good, but what about for individuals? Are there winners and losers? Yes, there are. Utility customers tended to benefit because rates improved. The electric rates decreased because greater usage led to economies of scale. And the gas rates did not go up as much as they otherwise would have due to avoided maintenance. The main group that did worse off were the customers who were required to electrify -- it is not cheap to retrofit, even with incentives. (6) In addition, about 25% also ended up with slightly higher bills. (7)

Utility bills decreased for 75% of customers and increased for 25%. Source: Energy and Environmental Economics report, 2023
The report recommends using some of the system-wide benefits (e.g., from avoiding gas maintenance) to help these customers. However, using too much would lead to very high gas rates, which could be problematic. So the authors suggest looking to outside sources of funding as well, especially for these first sites until electrification costs come down more.
At the end of the process, weighing not only economic feasibility but also factors like equity, ease of transition, and diversity of building stock, they ended up selecting three sites (C, F, and I):
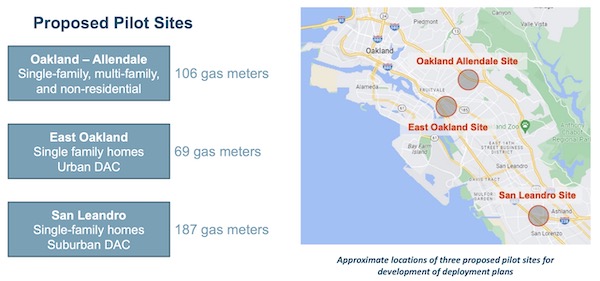
Three sites with different characteristics were ultimately selected for a potential decommissioning pilot. Source: California Energy Commission presentation, 2023
It remains to be seen how the communities respond to this opportunity. The reports to date indicate that the public engagement has been somewhat challenged (8), but it is critical to do it well since utilities probably will not be allowed to shut off gas if most customers object. (9) The results of the public engagement will be published this spring. In the meantime, I’d be curious to hear what would lead you to take your utility up on this offer. For me it would be a sense that this transition is inevitable and this is the best offer I am likely to get, that someone else will snap it up if I don’t take it. What about you?
Notes and References
1. District heating is another option in addition to electrification. If you are interested, E3 cites the following studies:
- The Challenge of Retail Gas in California’s Low-Carbon Future - Technology Options, Customer Costs, and Public Health Benefits of Reducing Natural Gas Use, California Energy Commission
- 2022 Scoping Plan Documents, California Air Resources Board
- Net-Zero America Project, Princeton University
- 2023 US ADP, Evolved Energy
- Decarbonization pathways for the residential sector in the United States, Nature Climate Change
2. This tranche cannot be very big because only a limited number of pipelines are planned for replacement in the coming years. One statistic in this E3 report says that PG&E’s distribution mains and services have an authorized service life of 57 years, suggesting that in any given decade, around 15% are replaced. The report cites another statistic that, at the rate PG&E is replacing pipelines recently, only about 10% would be replaced by 2045, which is significantly slower.
3. Ava Community Energy is the energy provider in the East Bay that used to be called East Bay Community Energy.
4. Although they looked at all customers in Ava’s territory that receive gas from PG&E, no candidate sites were identified in Albany, Dublin, Emeryville, Piedmont, Pleasanton, or unincorporated Alameda County.
5. The analysis was pretty thorough. They looked at the historic gas and electricity use of each of the 1500 customers to determine how they were heating their space and water, what rates they were paying, and how old the buildings were. This was used to determine which appliances would need updating, whether panel upgrades were needed, and so forth. It’s interesting to see what they found.
Some characteristics of the 11 candidate sites. Source: Energy and Environmental Economics report, 2023
6. The E3 team found that two-thirds of the appliance retrofit was due to space heating, with the remaining to water heating, cooking, and clothes drying.
7. Fewer CARE customers saw bill increases (14%) than non-CARE (34%).
8. One of the findings published so far is that outreach efforts need to be slow and comprehensive in order to establish trust. This is hard in part because people are busy. Even when offered $150 for two hours, plus free food and child care, only 45 people of about 9000 contacted showed up for focus group discussions. Without care, administration costs could hurt the overall economics of the program.
9. Currently utilities have an “obligation to serve”, so if any one customer insists on having gas, they would need to comply. A pending bill would require only a 67% opt-in for these pilot programs to enable gas shutoff. So the engagement process would need buy-in from most of the customers in the affected area.
Current Climate Data
Global impacts (October 2023), US impacts (November 2023), CO2 metric, Climate dashboard
Comment Guidelines
I hope that your contributions will be an important part of this blog. To keep the discussion productive, please adhere to these guidelines or your comment may be edited or removed.
- Avoid disrespectful, disparaging, snide, angry, or ad hominem comments.
- Stay fact-based and refer to reputable sources.
- Stay on topic.
- In general, maintain this as a welcoming space for all readers.


