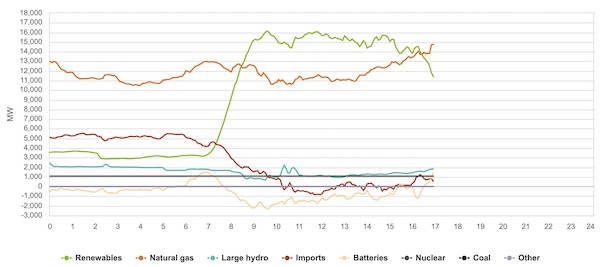
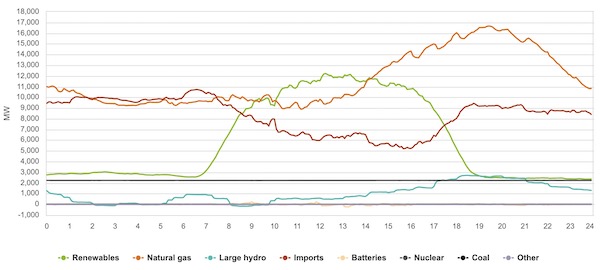
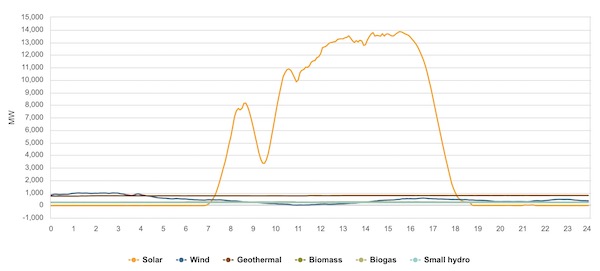
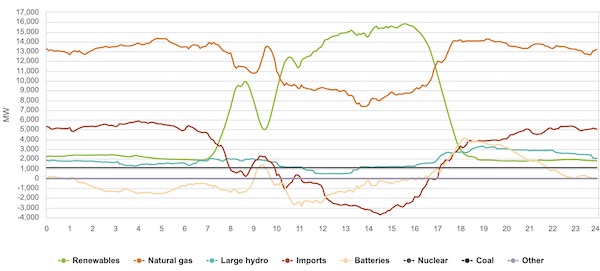
On Saturday morning a solar eclipse lasting about three hours will obscure most of the sun across the full expanse of the state and beyond. The eclipse will eliminate much of our solar power. Grid operator CAISO notes in its messaging to market participants: “This is a unique event … during which approximately 9,700 MW of solar generation will rapidly go away and then return within the span of less than three hours.”
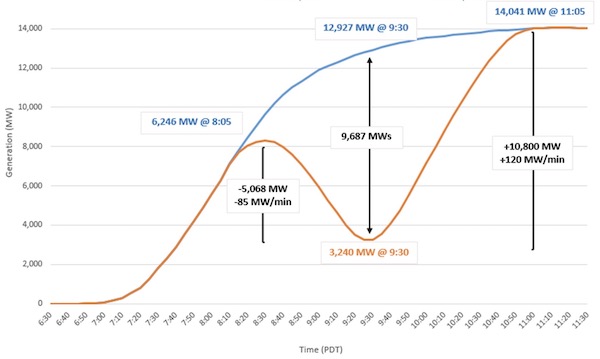
Solar power on the grid will plummet 9,687 MW (compared with a clear-sky October day) during the peak of the eclipse, and then rocket back up. Solar typically provides over half of the grid’s power on a clear October morning. Source: CAISO blog (2023)
Not only will much of the grid’s solar power vanish, but the load on the grid will go up at the very same time, as rooftop solar production drops and systems without battery storage turn to the grid for power.
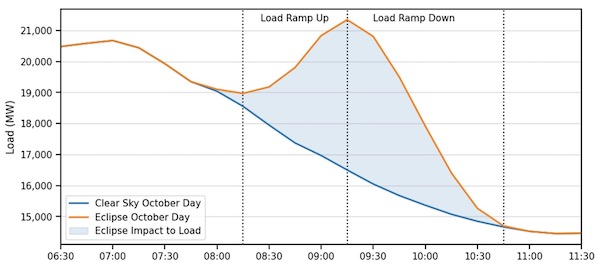
Demand on the grid will increase by around 5,000 MW as rooftop solar production drops during the eclipse and systems without batteries turn to the grid for power. Source: CAISO blog (2023)
This sounds like a doomsday scenario, but most likely none of us will notice it. How can that be?
First of all, we’ve had some practice. A similar eclipse occurred on Monday August 21, 2017. It was also in the morning, also across much of California and the United States. CAISO planned for it for over a year, and the accurate forecasting allowed the state’s power market to function as expected. Supply came online as configured the day before, with few real-time adjustments needed. That kept energy prices stable, with CAISO reporting afterwards: “Energy prices in both the day-ahead and real-time markets remained stable during the day, with real-time prices going no higher than $30/MWh.”
The additional supply needed came from a mix of imports (making up about half of the shortfall), thermal power (gas), and hydropower (it was a good water year), as shown in this graph.
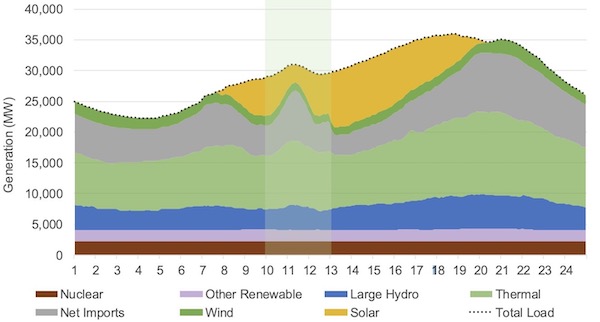
During the August 21, 2017 eclipse, additional resources were brought online when solar power disappeared. Source: CAISO report (2017)
This week’s eclipse is easier than the 2017 one in some ways but more difficult in others. On the plus side, it’s during a Saturday in October, when demand is typically lower than on a Monday in August. On the other hand, our reliance on solar power has increased substantially since 2017, both in CAISO and in the wider interconnected power market. Our greater reliance on grid solar means that we will see a bigger drop in our power supply. The larger amount of rooftop solar means that demand will go up more than it did in 2017. And our neighbors in the extended power market will start seeing those effects as well. (1)

Our reliance on both grid solar and rooftop (BTM: “Behind The Meter”) solar has grown substantially, increasing the effect of the eclipse on our power supply. WEIM: Western Energy Imbalance Market. Source: CAISO presentation (2023)
When you add up the impacts of both the reduced supply and the increased demand, we have a deficit of 14 GW over a typical October weekend morning.
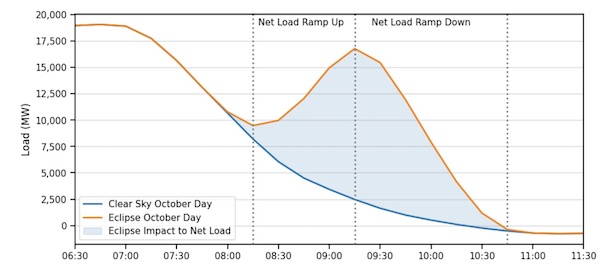
This chart shows the combined effect of both the diminished solar supply and the increased load, causing a deficit of up to 14 GW compared to a clear-sky October day. Source: CAISO presentation (2023)
Fortunately we have access to plenty of extra energy, with imports, gas, and hydropower all likely to play key roles as they did in 2017. In addition, our recently-added five GW of battery storage on the grid will be instrumental in keeping the grid stable while the power supply changes quickly over the course of the eclipse.
The quick ramping down and then ramping up of solar seems to be the most challenging part of this. The grid operator estimates that we will need to ramp up non-solar energy at a rate of 120 MW per minute as the sun gets eclipsed. When the more powerful sun comes back midday, we will have to ramp down those same resources even faster, with an average rate of 190 MW going offline every minute. That is one large power plant every few minutes! That is faster than anything we would typically experience on a normal day. CAISO operators say that they can proactively slow the rate at which solar resources come back online in order to help manage this down-ramp.
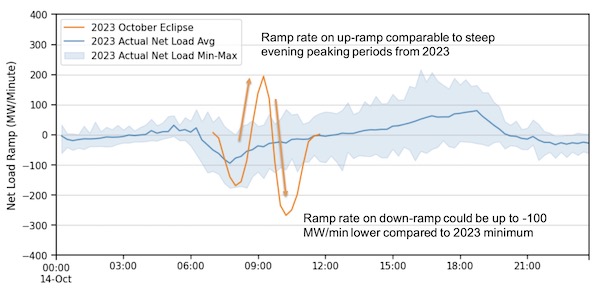
The y-axis in this chart measures how quickly we ramp up or down certain sources of energy. While the ramp-up rate during the eclipse is something we might normally handle on an October evening, the ramp-down is much faster than we would typically see. Source: CAISO presentation (2023)
The grid operators seem pretty confident about managing the eclipse, saying “We do not expect any impacts to businesses or residents.” CAISO's Senior Energy Meteorologist Jessica Stewart and Lead Forecast Modeler John Rudolph took the time to jointly write a great blog post about their approach. For the grid operators, this is just another exercise in planning, with the key being to get accurate forecasts and good market bids a day ahead. With good forecasts, they can keep costs and resource use down. But it will still be interesting to look at the CAISO dashboard to see how things go. How are we backfilling the supply? How useful are batteries? What does the ramp back look like?
I love that we are using cleaner energy every year and getting more comfortable managing events like this. Texas will be seeing the same thing but without access to imports, so it will be interesting to see how they manage it in comparison. And there’s more to look forward to -- another total eclipse is coming to the US on April 24, 2024!
Notes and References
0. One more thing happening on Saturday, October 14 is the Electric Home Tour, with 40 homes throughout San Mateo and Santa Clara counties. It’s free, but you need to register. Check it out if you’d like to see some of these efficient electric heaters, stoves, driers, or solar roofs in action and/or talk with the owners about their experience. The tour consists mainly of single-family homes, but there is also one retrofit townhouse, one duplex, one apartment complex, and a few ADUs, so hopefully you can find a home like yours to visit if you are interested.
1. The Western Energy Imbalance Market is much bigger than it was in 2017, with 22 members now compared with 4-5 in 2017. So these numbers reflect not only a growth in solar but also a growth in the market itself.
2. The eclipse leads to cooler temperatures and sometimes less wind, so those are additional effects that the operators account for.
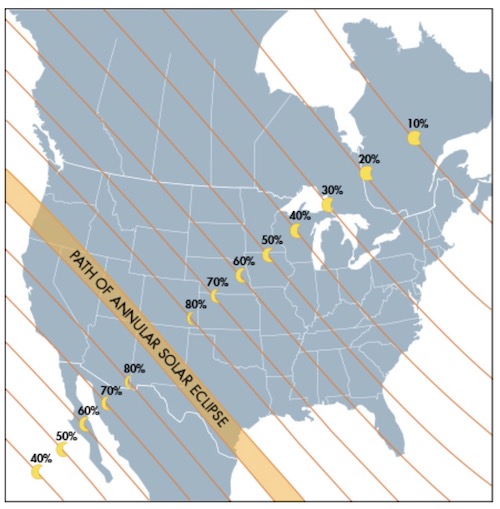
3. The path of Saturday’s eclipse is shown below.
Current Climate Data
Global impacts (August 2023), US impacts (August 2023), CO2 metric, Climate dashboard
Comment Guidelines
I hope that your contributions will be an important part of this blog. To keep the discussion productive, please adhere to these guidelines or your comment may be edited or removed.
- Avoid disrespectful, disparaging, snide, angry, or ad hominem comments.
- Stay fact-based and refer to reputable sources.
- Stay on topic.
- In general, maintain this as a welcoming space for all readers.


