California’s Greenhouse Gas Reduction Fund gets billions of dollars every year from fossil fuel companies via the state’s cap-and-trade program. The “core objective” of this fund is to reduce greenhouse gas emissions. Unfortunately, it does very little of that. And that is a problem as California aims to quickly and substantially reduce emissions.
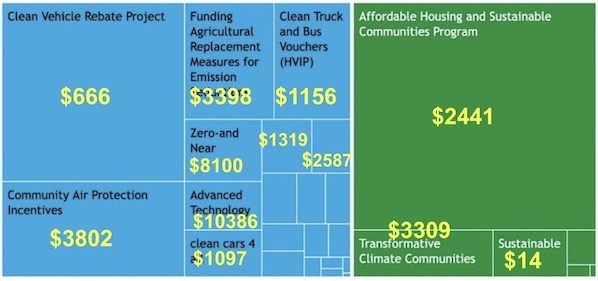
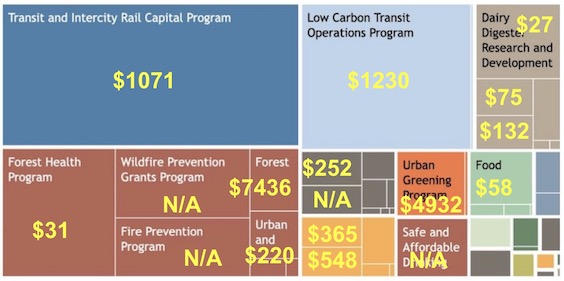
As shown in the diagram below, most of the Greenhouse Gas Reduction Fund’s billions is spent on programs that cost a staggering $1000 or more to reduce just one metric ton (MT) of CO2. On average, the program pays $463/MT even when using unrealistically optimistic projections of reductions. Compare that price to the cap-and-trade cost of carbon (around $35/MT), the LCFS carbon price (around $70/MT), or even the social cost of carbon ($200/MT). We are spending far too much to reduce emissions.

Each block in this diagram represents a cap-and-trade spending program. The size of the block reflects how much money that program has spent to date. The price is the program’s reported cost of reducing one metric ton of carbon. “N/A” indicates that the program has no emissions reduction goal. This diagram does not include high-speed-rail, which would be about half as big as this entire diagram and show a cost of around $1000/MT. Block diagram source: California Climate Investments Data Dashboard. Price source: Derived from Appendix A and Appendix C in the 2023 California Climate Investments Annual Report. There is a larger version of this diagram in Note (1) below.
Even worse, every year about 65% of the revenue is automatically allocated to just five programs that have an average cost of over $1500/MT. (2)
- High Speed Rail: 25% of all revenue
- Affordable Housing and Sustainable Communities: 20% of all revenue
- Transit and Intercity Rail Capital: 10% of all revenue
- Low Carbon Transit Operations: 5% of all revenue
- Safe and Affordable Drinking Water: 5% of all revenue up to $130 million
State Senator Josh Becker (D-13) is not happy about this. “How much did California reduce emissions last year? I think we’ve been averaging about 1%. We need to get 4-5% a year to hit our 2030 goals. We have a lot of work to do. This is a big pot of money for that, and it’s a great concern for me that we are not optimally using it.”

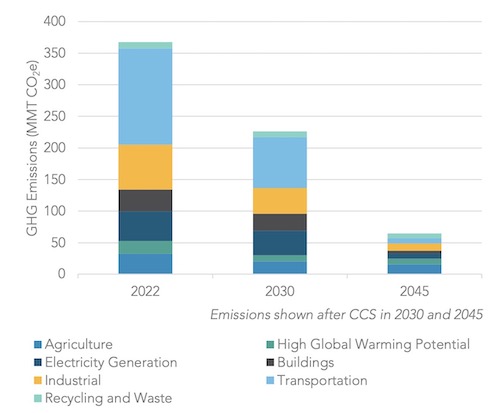
California has aggressive emissions reductions goals. Source: California Air Resources Board 2022 Scoping Plan Update for Achieving Carbon Neutrality
The exceedingly high carbon reduction price we are paying is only one of the problems with how the fund is administered. The emissions reductions themselves are overestimated, the reported costs are too low by a factor of five, and, perhaps most important, no changes are being made even though many of these problems have been reported for years by the Legislative Analyst’s Office, by the State Auditor, and by others. As climate economist Danny Cullenward puts it, “No one is listening. This is very clearly something that’s been on auto-pilot for some time. No one seems to care.”
Well, that has to change. Cap-and-trade revenue is projected to increase in the years to come. The carbon price has gone up from $30 to $37/MT just this year and 2023 revenue is on track to be at least 10% more than 2022. Washington State’s more effective “cap and invest” program is already bringing in around $60/MT. Beyond this, California is going after even more fossil money with its recently announced lawsuit. We must do a better job of spending this money.
Grossly Overpriced “Carbon Reduction” Programs
As I mentioned above, almost all of the cap-and-trade revenue is being invested in extremely high-priced carbon reductions, and about two-thirds of those investments are automatically approved every year. There is little critical oversight. Cullenward observes: “There's a role for politically motivated spending in real-world political systems, especially controversial policies like cap-and-trade. But there's no question that pork (unrelated spending) is dominating policy effectiveness here.”
How easy is this to change? Some of the spending decisions were made years ago. I asked Senator Becker if he feels that legislators are more inclined now to devote this money to emissions reductions. “Well, it’s not easy. At one level they are bought in, but when it comes to cutting a project that benefits their community, it’s not so clear. One thing that we should do at minimum is put a cap on some of these continuous appropriations so that they do not keep growing as we collect more cap-and-trade revenues.”
We should also be up front about which programs are not meant to reduce emissions. A few don’t publish emissions reductions numbers because it’s not their goal. Those are generally related to climate adaptation in priority communities and include efforts like preventing wildfires, addressing sea level rise, or ensuring access to plentiful clean water. But too many programs claim to be about emissions reductions when they are not.
Senator Becker says “We should be looking at the biggest bang for the buck emissions reductions, and we are not doing that. We should be looking at hard to decarbonize sectors like steel, cement, and agriculture. We made some small changes this year, for example funding feed additives for cows, and performance standards for buildings, but it’s not enough.”
Unrealistic and Inflated Emissions Reduction Estimates
Not only are the costs high, but the projected emissions savings are overly optimistic. They are self-reported by the programs receiving funding, often using a methodology designed by the California Air Resources Board. Problems have been reported for years. A few months ago the Legislative Analyst’s Office wrote: “Our office and the State Auditor have raised concerns about the methodology the administration uses to estimate emissions reductions attributed to cap-and-trade-funded programs. In particular, in some cases the methodology does not account for the effects of the interaction of incentive programs, such as for clean transportation programs.”
Consider the case of EV rebates. It’s not enough to know how many people buy an EV with that rebate. You really need to know how many people would not have bought an EV without that rebate, or at least a rebate of that size. The state has many programs and regulations encouraging EV adoption. What effect is the rebate having over and above those programs, or simply the high price of gas? That is what you need to report, but few of the programs do the work needed to get to that estimate.
As another example, the Affordable Housing and Sustainable Communities program built 1353 housing units in 2022 and claimed a reduction of 414,168 MT. That nets out to over 300 tons of emissions saved per unit. That seems implausibly generous. A typical gas-heated multi-family home generates about 2 MT per year in heating emissions. Transportation might generate another 4 MT. How do you get 300 MT in savings for a single unit? Are we assuming that electricity has no emissions, that new residents never drive, and that without this program residents would be driving gas cars and using gas heat for 50 years?
The program with the lowest priced emissions reductions, by far, is the “Sustainable Agricultural Lands Conservation Program,” at just $14/ton. This program puts easements on agricultural land for a low cost, and then takes credit for the difference in emissions savings between rural housing that might have been built there and denser urban housing that presumably would be built instead. An urban house might use less gas for heating than a rural house, and an urban commuter might drive less than a rural commuter. But do we know by how much? Policies might require all-electric construction in either place. People might work many days from home, or drive electric cars. Businesses might set up in larger rural developments. Housing blocked from a given rural parcel might just move to another rural area since urban housing is more expensive. And so on.
We should be scrutinizing these claims in the same way that the carbon offsets used by companies are being examined. We cannot afford to pay for reductions that aren’t real.
Flawed Reporting of Emissions Costs
Finally, the costs that are reported by the Greenhouse Gas Reduction Fund are five times smaller than the actual costs. The annual report issued on cap-and-trade spending touts an average carbon price of $96/MT, and not the $463/MT I am reporting here. That is due to a mathematical error. Instead of comparing each program’s costs with its projected emissions reductions, it compares the fund’s (partial) investment in the program with the program’s (total) projected emissions reductions. Since on average the fund pays for only 20% of a program, the claimed emissions costs are understated by a factor of five. This error has been pointed out by the Legislative Analyst’s Office (LAO) and others. From as early as April 2016: “The administration’s estimates appear to include all GHG reductions associated with a project, regardless of the portion of total funding that is provided by the state.” Cullenward calls it out in his 2020 testimony to the Senate Budget Committee. I asked LAO staff member Sarah Cornett about this, who replied “I will just say that we have been reporting some of these problems for years.”
How Can We Fix This?
We can fix this. To begin with, we should cap the funding that rolls over every year, and fix the reporting to correctly reflect the price we are paying to reduce carbon emissions. Then legislators need to re-assess the spending portfolio to prioritize cost-effective and/or innovative emission reduction programs, and scale the best ones. Analysts need to critically review the emissions reductions projections, particularly for those programs that claim the most. Senator Becker suggests that the upcoming process to extend cap-and-trade beyond 2030 might be a good time to do that.
Over 70% of the claimed emissions reductions come from just four programs, three of which are low cost. If we do a deep dive on only the reduction claims for these programs, it would be very helpful.
- Dairy Digester Research and Development (22%, $27/MT)
- Forest Health (20%, $31/MT)
- Transit and Intercity Rail Capital (18% -- high cost at $1071/MT)
- Sustainable Agricultural Lands Conservation (11%, $14/MT)
We also need to be doing much more to develop and scale innovative reduction programs. Some of the more cost-effective but smaller programs that are receiving cap-and-trade money include:
- Fluorinated Gases Emission Reduction Incentives -- replace older refrigerants with cleaner ones
- Training and Workforce Development -- train young adults in green jobs
- Food Waste Prevention and Rescue -- prevent and redirect food waste
- Water-Energy Grants -- reduce water and water-energy use
- Food Production Investment -- reduce energy and emissions from food production
Can we verify these emissions reductions and, if they prove out, scale these programs? What is the process for getting innovative new programs in the pipeline? We should be taking as many of these promising ideas as possible, nurturing them, and investing to scale the best ones.
California’s cap-and-trade program is a good step towards making polluters pay for the damage they are doing to our environment. But we need to be much more deliberate and strategic with our spending to ensure that the Greenhouse Gas Reduction Fund is measurably and meaningfully reducing the greenhouse gases in our atmosphere.
Notes and References
1. Here is a closer up version of the diagram at the top of this blog post. It is divided into two pieces because images in this blog are limited to 600 pixels in width.


2. The water quality program reports that it increases emissions. I omitted that program from the average since it doesn't say by how much. An additional $200 million is allocated every year to “forest health and wildfire prevention activities”. Those have mixed costs for emissions reduction, and it’s unclear how much of the $200 million goes to which program, so I omitted these from the average as well.
Current Climate Data
Global impacts (August 2023), US impacts (August 2023), CO2 metric, Climate dashboard

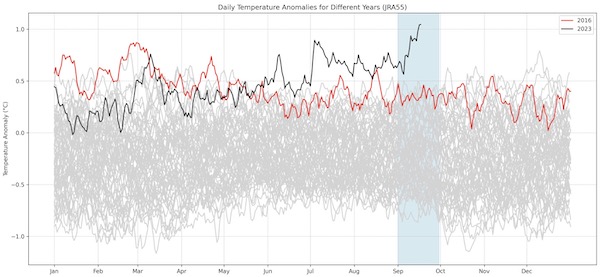
This graph shows global daily temperature anomalies -- differences from normal -- for all years on record. The black line is 2023, the red line is 2016, the gray lines are every other year. The blue shaded area is September. September 2023 has been incredibly warm. Here in the Bay Area, we have 90-degree weather this first week of October. Source: Zeke Hausfather on X/Twitter
Comment Guidelines
I hope that your contributions will be an important part of this blog. To keep the discussion productive, please adhere to these guidelines or your comment may be edited or removed.
- Avoid disrespectful, disparaging, snide, angry, or ad hominem comments.
- Stay fact-based and refer to reputable sources.
- Stay on topic.
- In general, maintain this as a welcoming space for all readers.


