Palo Alto is currently reviewing its power portfolio and developing a plan to guide procurement in the coming decades. Senior Resource Planner Jim Stack gave an update to the Utilities Advisory Commission last week. No one from the public spoke at the July 5 meeting, so I’ll go over the content here to see if you have any comments or questions. Don’t worry, it’s more interesting than it sounds!
The City of Palo Alto Utilities (CPAU) owns or contracts for several different sources of electricity. Regulations constrain the mix that forms our power portfolio. The state sets rules for energy, capacity, and renewable purchases. (1) Energy refers to the amount of electricity measured in MWh. CPAU contracts for enough low-emission energy to meet its 100% carbon-neutral goal. (2) The energy the city purchases also has to meet annual renewable targets, which include 44% by 2024, 52% by 2027, and 60% by 2030. (Not all low-emission energy is considered renewable, specifically large hydropower and nuclear.) Third, the city has to ensure that energy is made available when and where it’s most needed. This “capacity” or “Resource Adequacy” rule requires power providers to buy enough power to match peak use every month (plus a reserve), and to buy some power that is local (in case of transmission issues) and that is flexible (can ramp up quickly). These Resource Adequacy constraints do not perfectly match demand with supply (for example, there is no hourly match requirement), and indeed the regulators are constantly adjusting (tightening) these rules to ensure the lights stay on. Power that meets these Resource Adequacy requirements is referred to as “Net Qualifying Capacity”. Every power provider must purchase enough of it. (3)
The energy contracts that CPAU currently has active are shown below. You can see that the primarily solar plus hydropower portfolio produces about 1000 GWh of energy each year in long-term contracts, enough to meet Palo Alto’s annual energy use. About 60% of that is renewable, more than enough to meet state requirements. The contracts also produce about 280 MW of Net Qualifying Capacity, again more than we need. (4) We can and do sell excess renewable credits and capacity to keep our rates low and to fund our electrification efforts.
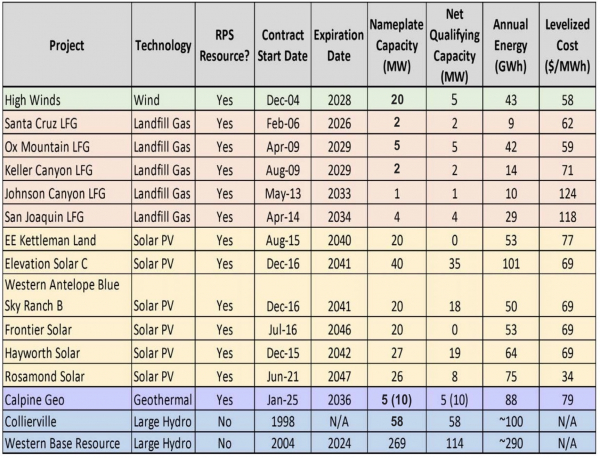
Palo Alto’s current electric supply portfolio. Source: Palo Alto Utilities Advisory Commission presentation, July 2023. I made corrections to the nameplate capacity in a few cases to reflect that we only get a partial share.
So our portfolio is meeting our needs. But are we getting good value for our money? The utility staff worked with consultant Ascend Analytics to evaluate the portfolio, comparing the costs (what Palo Alto is paying) to the benefits projected by the consultant’s models (the forecast value of the energy, capacity, and renewable credits). The chart below shows what they found. If you add up the projected value of the energy (column 3), the renewable credit (column 4), and the capacity (column 5) for each contract, and then compare it to the cost (column 2), we are in the money on most of our contracts (column 6). Just two solar and two landfill gas contracts are projected to fall short.
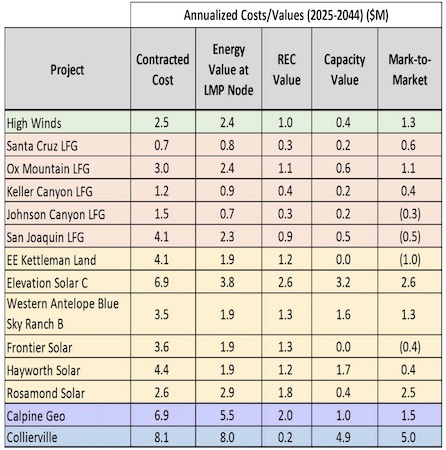
The cost (column 2) of our contracts is in most cases less than the value (columns 3-5), as shown in column 6. Source: Palo Alto Utilities Advisory Commission presentation, July 2023.
You can see that our Collierville hydropower project is proving to be a particularly good value. That was not the case until recently, but today its ability to store power and release it at opportune times (“flexible hydropower”) is proving quite valuable. The federal hydropower project that we have been in contract with is not as flexible (5) and will have different terms, but staff has tentatively concluded that it is good value for the money. Palo Alto will continue to get much of its energy from these two large hydropower plants. (Our large federal hydropower contract is not listed here, presumably because we are still evaluating it.)
There are a couple of interesting things if you look at energy data from the two charts. See the table below.
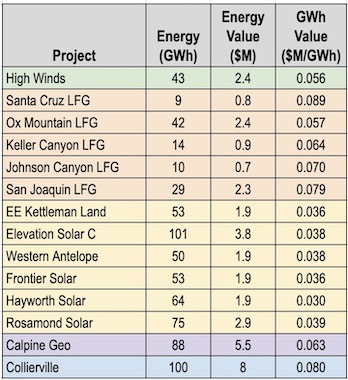
The value of a GWh of energy varies between projects, as shown in the fourth column. Data source: Palo Alto Utilities Advisory Commission presentation, July 2023.
Solar energy is worth less than wind, which is worth less than geothermal, landfill gas and hydropower. That is because the value of energy depends on when it is available. Geothermal (for example) is available at more valuable times than solar. But there is substantial variability within a category as well. How can that be? That is because the energy value is determined not only by how much energy is produced and when, but also where it is produced. The Ox Mountain and San Joaquin landfill gas projects both create about $2.3M in energy value per year even though Ox Mountain produces almost 50% more energy. It could be that San Joaquin is in a region with transmission constraints, where local power is more valuable.
It's also interesting to look more closely at the capacity numbers. The nameplate capacity is the maximum power that a plant can produce at a given time. The net qualifying capacity (NQC) is how much power is available during peak periods, when the grid is most stressed. For a steady baseload resource, there is no difference, but some resources are variable. See the table below.
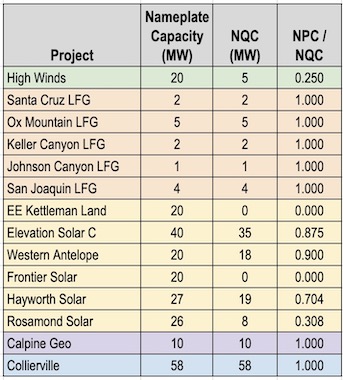
The capacity of Palo Alto's solar projects is unexpectedly high. Data source: Palo Alto Utilities Advisory Commission presentation, July 2023.
Our solar capacity is unexpectedly high for several projects, almost as high as the nameplate capacity. It took me a while to figure out why that is. The reason is that the rules for determining capacity that Palo Alto set in 2008 consider the hours from noon to 6pm to be peak demand, and solar has high production then. The state, in contrast, uses evening hours, something like 5-9pm. This chart also happens to show September data, when solar has relatively high power in the afternoon. Two solar projects show zero capacity because their power is not widely available if the grid is stressed, since they are in transmission constrained areas. All of these factors have to be accounted for when determining the value of a contract.
So, we have a good portfolio -- it meets requirements and is cost-effective -- but nevertheless we need to evolve it. Why? Demand is increasing, contracts are expiring, and the regulatory environment is changing. Let’s start with the increase in demand, which you can see in the chart below. It’s not often you see a 20% increase in just a few years! In case you are wondering, no, it’s not because of electrification. (6)
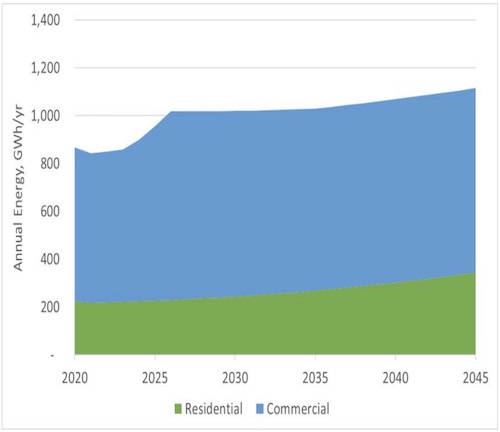
Commercial demand is increasing by almost 200 GWh/yr over the next few years due to two new data centers being deployed in Palo Alto. Source: Palo Alto Utilities Advisory Commission presentation, July 2023.
Commercial demand, which is already much greater than residential demand in the city, will grow by around 25% in the next few years. Two large customers are each deploying a massive new data center in the city, together consuming almost as much energy as our entire residential use. The city will have to move quickly to cover the looming gap in supply, as shown below.
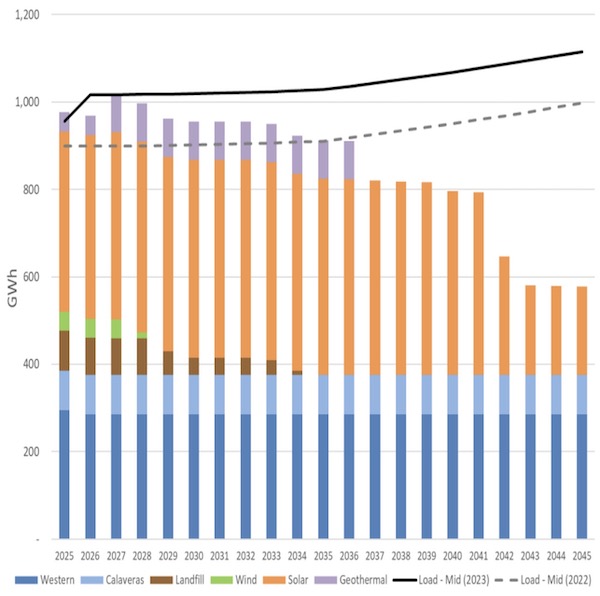
Our energy supply (shown in colored bars) will likely fall short of demand (shown as a dark black line) in a few years. Before the two new data centers were coming online (demand shown as a dashed gray line), we were in better shape. Source: Palo Alto Utilities Advisory Commission presentation, July 2023.
Our expiring landfill and wind contracts do not make that any easier. While it will likely be possible to renew them, we don’t know yet what the terms will be. Assuming we would contract at market rate, Ascend Analytics’ preliminary modeling determines that it makes more economic sense to stick with solar and eventually some storage to meet our requirements.
But that is not the last word. Another consideration as we evaluate our portfolio is the regulatory environment. Our solar and hydropower resources underperform in fall and winter, and solar obviously underperforms at night. This exposes us to market price risk, since during those months we have to buy capacity from the market. It also means that we are continuing to rely on the largely gas-based resources that are available at those times.
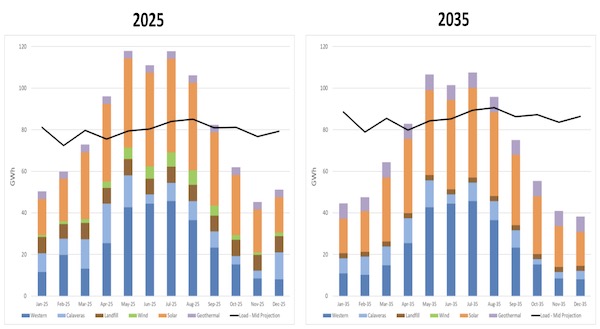
Palo Alto’s current portfolio is long in the spring and summer and short in fall and winter. When we are short, we purchase capacity from the market, much of it likely gas-powered. Source: Palo Alto Utilities Advisory Commission presentation, July 2023.
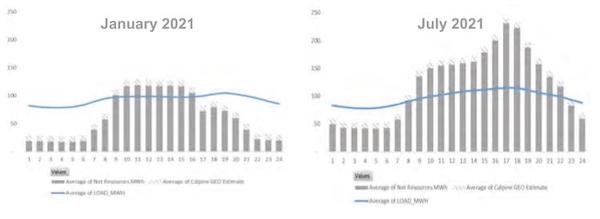
Similarly, on a winter day or even a summer day, Palo Alto’s contracted energy (gray bars) doesn’t match its load (blue line) in the night hours. (Hours from 1am through midnight are shown on the x-axis, energy from 0 to 250 MWh is shown on the y-axis.) Source: City of Palo Alto Utilities Staff Report, December 2022.
The city may choose, or the state may require us, to better match our supply to our demand on an hourly or seasonal basis, which would move our portfolio away from solar and towards more baseload (e.g., geothermal) or flexible (e.g., storage) resources. Stack says that while hourly-based rules will be going into effect for larger power providers in a few years, “I’m not sure if the CAISO could impose this (on municipal utilities like CPAU) on its own, or if it would take legislation to do that. But if that was imposed on us, it would have a big effect (one that’s difficult to predict at this point) on how we manage our portfolio.” In the meantime, once the power plan is finalized, Stack will work with Ascend Analytics to determine what the cost tradeoff might be for better aligning the city’s supply with its demand on an hourly or seasonal basis.
I hope this gives you some idea of how power planning and energy markets work. As we evaluate long-term contracts, we balance competing factors such as cost, policy value, and risk. In the meantime, changes in the regulatory environment can make expensive purchases like our long-ago purchase of hydropower a better deal in the future. Technology is also changing, as is demand. Our planners try to predict all of this, evaluate our ability to mitigate (hedge) our risk, then adjust as new information comes to light.
I’d love to hear what questions you have and what you would prioritize in our portfolio.
Notes and References
0. Thank you very much to CPAU Senior Resource Planner Jim Stack, who patiently and comprehensively answered my questions, and on a Saturday no less!
1. The state also asks power providers to provide “ancillary services”, which can include resources capable of quickly regulating the frequency on the grid (batteries are good at that), of starting up after a power outage with no power other than a generator (hydropower plants can often do a “black start”), and more.
2. CPAU signs long-term contracts (“power purchase agreements”) for energy in order to achieve its carbon-neutral goal and to reduce its exposure to electricity market prices. In a few cases CPAU owns the power plants (e.g., the hydropower plant in Collierville, CA). The utility sells this owned or contracted energy into the market and then buys energy from the market to match its actual use. The energy it buys on the market is not reflected in these charts, and will often include a grid mix with gas. The city does account for these emissions when determining its carbon-neutral status.
3. Often a power provider buys capacity and renewable credits along with energy. For example, a purchase of geothermal energy would often come with good capacity value and renewable credits. But these can be bought and sold separately as well.
4. In case you are interested, this chart shows how we are meeting our capacity requirement.
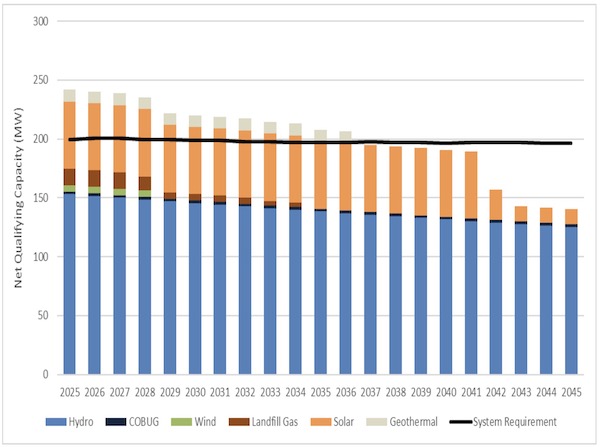
Palo Alto’s current portfolio easily meets our capacity requirements. This is due to hydropower that we can deploy in the evenings, when capacity values are highest, and to solar contracts that produce a lot in the 12-6pm period, which Palo Alto uses to determine capacity. Source: Palo Alto Utilities Advisory Commission presentation, July 2023.
5. Senior Resource Planner Jim Stack says: “We can largely shape the energy allocation (for the federal hydropower) into the hours that we want to receive it. We just have to make these decisions about a day in advance, so it's not quite as flexible or responsive as Collierville.”
6. This graph shows the magnitude of the projected impact of electrifying our transportation and buildings vs that of the two new data centers.
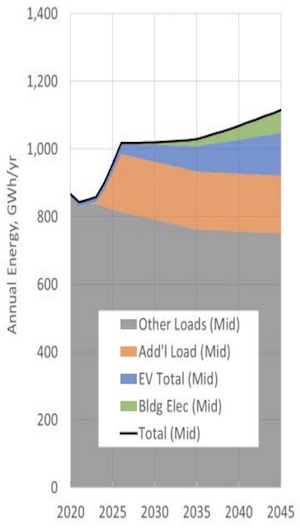
Energy demand from two new data centers in the city dwarfs the projected increase in demand from electrification. Source: Palo Alto Utilities Advisory Commission presentation, July 2023.
Current Climate Data (May 2023)
Global impacts, US impacts, CO2 metric, Climate dashboard
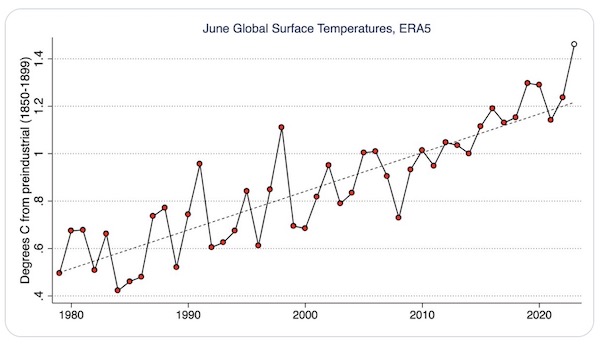
June 2023 global temperatures blew away those of previous years.
Source: Zeke Hausfather on Twitter
Comment Guidelines
I hope that your contributions will be an important part of this blog. To keep the discussion productive, please adhere to these guidelines or your comment may be edited or removed.
- Avoid disrespectful, disparaging, snide, angry, or ad hominem comments.
- Stay fact-based and refer to reputable sources.
- Stay on topic.
- In general, maintain this as a welcoming space for all readers.


