Two weeks ago I attended a day-long conference on climate-related topics at the Hoover Institution. There were some substantive discussions and terrific guests, as I wrote about last week. But there were some less copacetic aspects of the conference. For example, how was it that out of the 16 panelists and moderators involved, only one (1) was a woman? How is that even possible in this day and age, let alone at an institution like Stanford?
Yet I didn’t notice that gap until the next day when I was thinking back over the conference. What struck me instead the day of the conference was the climate misinformation that was being presented, at an institution that should know better, coupled with the fact that those same speakers were lamenting the spread of climate misinformation. It would be funny if it weren’t so characteristic of some of the policy challenges we face. Global warming is causing changes across Earth’s ecosystems that we will mitigate or adapt to. If we can’t agree on a basic set of facts about what is happening, forging agreement on directions and solutions becomes that much harder.
Look, heaven knows that climate science is complicated and constantly evolving. It is not realistic to expect perfect communication on any given topic. But this was more intentional, and it was an eye-opening experience for me. Misinformation happens on both sides of the political aisle; I’ve written about alarmist rhetoric before. But this bothered me enough that I want to go through it in some detail.
Because science is complex and this blog post is (supposed to be) short, I am going to focus narrowly on one topic here, namely sea level rise, though I will also touch on the health of the ocean. What was asserted, what are the facts, and what do marine scientists think about these spurious claims? There were no environmental scientists speaking at the conference, and I didn’t notice any in attendance. So I reached out to Sarah Gille, a professor of ocean science at UC San Diego’s Scripps Institution of Oceanography. I also read some of the authoritative information available online about sea level rise. (1)
During the conference, the claim was made repeatedly that sea level rise is happening at a rate of just 2 mm/year. “Two millimeters a year!” proclaimed one of the first panelists several times, gesturing with his hand to show that by 2050 this was only 2.5 inches. He asserted we cannot possibly need a “grand plan” for this, and argued that all the worry about sea level rise is misplaced. When I pointed out to one of the attendees nearby that the claims were not correct, he snickered at me and retorted “I bet you believe that the ocean is boiling too!” What?
A few subsequent speakers spoke along the same lines, and the keynote speaker made even broader claims, suggesting that the ocean is generally in fine fettle. He dismissed concerns about acidification by pointing to snails that build stronger shells in more acidic water. He spent some time going over graphs of the shells of these snails in different pH’s of water. (This speaker was not a scientist, but a writer and politician.) Somewhat remarkably, this speaker -- remember, this is the keynote speaker -- prefaced his remarks by saying that he wasn’t entirely sure he believed everything he was about to say. But then he went on and said it, with no qualifications, ultimately concluding that global warming is in fact a net good for the planet.
Global Mean Sea Level Rise
So, to set the record straight, here is what is happening with sea level rise. (2)
- Between 1901 and 1990, seas rose about 1.35 mm/year
- Between 1993 and 2018, seas rose about 3.25 mm/year
- From now through 2050, seas are projected to rise about 5.3 mm/year.
You can see how sea level rise is accelerating in the graph below from NASA.
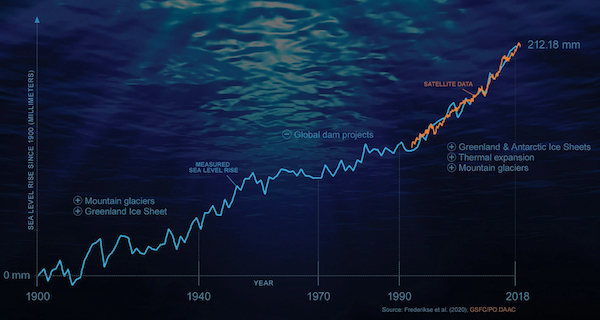
Global mean sea level rise since 1900. Click here for a larger version. The blue line shows tide gauge data and the red line (since 1993) shows satellite data. Melting land ice and warming waters are accelerating sea level rise. Source: NASA (2020)
Gille explained that for a long time marine scientists thought that sea level rise was linear. But it has become evident that it is accelerating, with the primary contributors being melting land ice (e.g., glaciers melting from land into the ocean) and the increased heat of the oceans (warmer water has more volume). Records of tide gauges have long been kept to support shipping traffic, and over time scientists have analyzed the data to determine which of those instruments were most reliable. Since 1993, sea level rise has been measured by satellites, with great accuracy and coverage. Gille refers to this as the “gold standard” of measurements.
We have very good visibility into how and why the seas are rising. Gille explained that we can separately measure the different components of sea level rise. We can measure the thermal component using Argo floats, which are instruments that go down a full mile into the ocean and are distributed all around the world. We can also measure the land ice melt with satellites that look at gravity fields and record the shifting of mass.
The main questions about sea level rise data are no longer about the reliability of the instrumentation. Instead, the questions are more about representation. For example, if oceans rise during an El Niño year, should the data be incorporated in the general data set? Scientists are constantly working through these issues to ensure their data are reliable and accurate.
Sea Level Rise is Not Uniform
But average sea level rise is not the end of the story. Something that is unintuitive is that sea level rise is not uniform. For example, in areas where the water is warming more quickly, the seas are rising faster. Where offshore winds are keeping the water cool or blowing it away from land, the seas are rising more slowly. In the United States, for instance, the oceans off the east coast are warming quickly with NOAA projecting seas there to rise 10-14 inches by 2050. In contrast, the seas off California are not warming as quickly and only 8-10 inches of rise are projected by 2050.
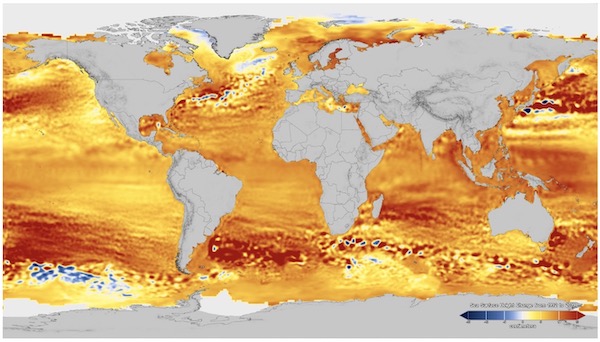
Regional sea-level change between 1992 and 2019 is shown in this picture, with darker orange representing greater change. Click here for a larger version. Take a look at the changes in Indonesia, at 10–12 cm, compared with the California coast at 3–4 cm. Source: NASA
There are many factors besides water temperature that contribute to regional differences in sea level. Some are related to climate change (e.g., storm surges) and some are not (e.g., tides). Stronger storm surges coupled with higher sea levels result in more frequent flooding, and high tides can make this even worse (e.g., Hurricane Sandy).
Even on clear days, some coastal Atlantic cities are seeing twice as much “sunny day flooding” as they did in 1990. This is partly due to sea level rise and partly due to land subsidence (sinking). Parts of the East Coast are subsiding at 2 mm/yr as continental plates slowly relax from long ago glacier melt. Parts of the Gulf Coast are subsiding more rapidly due to extraction of groundwater and/or fossil fuels. When land near the coast sinks, it exacerbates the effect of sea level rise. There’s a good, short video on the worsening flooding on the East Coast here.
Earth’s uneven gravity fields also lead to uneven rises in sea level. When ice sheets melt, the gravitational pull in that area is reduced. Oceans near the ice melt fall down while those farthest away from the melt rise up.
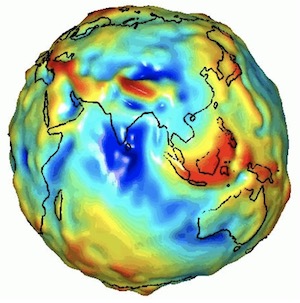
Earth’s gravity fields are not equal because its mass is not evenly distributed. Differences in the gravitational force lead to uneven sea levels. Source: NASA, from satellite data.
The Earth’s water cycle, ocean currents, and climate oscillations also affect sea-level, as they move water from ocean to land and back.
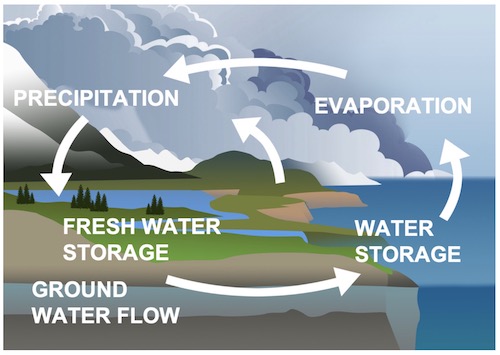
Image source: NASA
One consequence of all of this is that flooding will get worse, especially when regional effects amplify sea level rise. Floods that would do nothing more than cause cars to take a detour will instead damage houses, and floods that would damage houses every ten years will instead make areas unlivable. NOAA’s Sea Level Rise Technical Report (2022) says that “‘moderate’ (typically damaging) flooding will occur more frequently in 2050 (4 events/year) than ‘minor’ (mostly disruptive, nuisance, or high tide) flooding occurs today (3 events/year). ‘Major’ (often destructive) flooding is expected to occur five times more often in 2050 (0.2 events/year) than it does today (0.04 events/year).” Many coastal communities are already taking action. NASA has facilities on many of our coasts, and explains how it is adapting in this interesting video.
Levees and other barriers that have served us well in the past no longer will as minor flooding becomes more significant. It is useful to know averages, but what people experience and what they care about is not the average.
Ocean Health
The keynote speaker was dismissive not only of sea level rise, but of concerns about the health of the ocean in general. He did not dispute the fact that the ocean is getting warmer, that it is getting more acidic, and that it is losing oxygen. But he was pretty sanguine about the impact on marine life, in particular citing those resilient snails.
But what does the IPCC’s Sixth Assessment have to say?
Warming, acidification and deoxygenation are altering ecological communities by increasing the spread of physiologically suboptimal conditions for many marine fish and invertebrates (medium confidence). These and other responses have subsequently driven habitat loss (very high confidence), population declines (high confidence), increased risks of species extirpations and extinctions (medium confidence) and rearrangement of marine food webs (medium to high confidence, depending on ecosystem).
But what about the snails? The ocean has always had, and continues to have, different levels of heat, acidity, and oxygen, and marine life has adapted. Some animals like to live near highly acidic CO2 vents. Others enjoy tidepools, where temperature, acidity, and oxygen levels change on an hourly basis. Species in these places are well adapted. But fish in the deep ocean have not evolved to live in a tidepool. The changes now are happening rapidly and in a single direction -- warmer, more acidic, less oxygen. Evolution can’t keep up, and habitat for many species is contracting.
That has impacts on marine life and the people that depend on healthy marine ecosystems. I heard a scientist describe how lobsters on the Atlantic coast, which is quickly warming, are “migrating, no they are running, towards Canada, at 2-4 miles per year”. Low oxygen levels disrupt physiological processes, for example making it hard for some fast-moving predators to see at night. Marine life may depend on kelp, or coral reefs, or shellfish, which do not migrate quickly. Fish will congregate in pockets of higher oxygen or cooler water, making them more vulnerable to predators (and over-fishing).
Many of us have seen directly how warmer water exacerbates other problems. Warmer water plus excess nutrients (sewage, fertilizer) can result in toxic algae blooms that then decay in a process that removes oxygen from the water, causing fish die-offs.
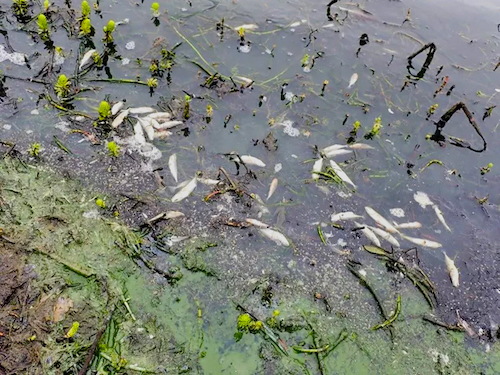
From the National Park Service: “Large concentrations of various types of cyanobacteria, called algae blooms, turn the water in Rodeo Lagoon a vivid green pea soup color and their collapse can cause oxygen in the lagoon to drop to levels that can’t support life, leading to fish kills.”
Warmer water impacts ocean circulations, which affect weather all over the planet. No, the ocean isn’t “boiling”. But it doesn’t have to be for scientists to be pretty concerned about it.
Misinformation vs Uncertainty
Gille points out that there is a difference between misinformation and uncertainty. “Uncertainty is at the heart of everything that we do. We are constantly looking at data to assess and reduce sources of uncertainty.” Furthermore, science naturally evolves. She mentioned how sea level rise had long been thought to be linear, but now we see it is accelerating. “Similarly, we thought warming was happening only in the upper ocean. But no, the deep ocean is warming. We see astonishing warming at 1000 meters. Even at 5000 meters. We also see changes in pH and changes in circulation that we didn’t expect. This is a very dynamic situation.”
But misinformation is not reflections on uncertainty and evolving science. Sometimes people spread falsehoods or misleading half truths. But other times they attack the methods and the science itself. “There is a degree to which contrarians come in, who know little about what we are doing, and they just try to poke holes. Sometimes they take the time to really look at the underlying data and methods, and then they understand what climate scientists are doing and saying. But often they don’t. It’s just not productive or helpful.”
There are many reasons that people spread misinformation. Sometimes there is a political agenda -- a desire for more or less government can influence what a person believes or says about climate change. Biased or careless social, print, and video media can limit peoples’ access to reliable information. Confirmation bias can skew what a person absorbs. And limited time and attention leave dense authoritative sources unread. A friend of mine who is not lacking for brains describes his struggles with authoritative sources in a substack titled “Reading Scientific Papers is Hard”. None of us are experts and even if we were, it’s hard to convey complicated science to a lay audience.
But, in my opinion, if you are going to be talking to an audience at Stanford University, you should do your homework, understand the current science, and mean what you say. What you end up presenting may not be as pithy, or as emotionally satisfying, or as aligned with your political tribe. However, you may earn credibility with a wider audience who will better hear what you have to say. Let’s discuss the value of biodiversity, not preemptively throw it under the bus. Let’s talk about the speed of evolution and the pace of adaptation, not make wishful assumptions. And let’s talk about the good news without dismissing the bad. The best news of all will be real progress, and we cannot get from here to there without a solid grounding in facts.
Notes and References
1. The IPCC’s Sixth Assessment on Ocean, Cryosphere, and Sea Level Change, Biogeochemical Cycles (ocean acidification and deoxygenation), and Oceans and Coastal Ecosystems are the go-to authoritative sources, but they are dense and hard for non-experts to read. The 2022 Sea Level Rise Technical Report from our national weather service (NOAA) is a good resource about sea level rise in the United States. For a layperson, I think NASA’s sea-level rise overview is a great place to start. Or, if you’re more of a video person, check out this YouTube playlist on sea-level rise from NASA’s Goddard Space Institute. If you just want a graph of sea-level rise, check out the University of Colorado’s Sea Level page.
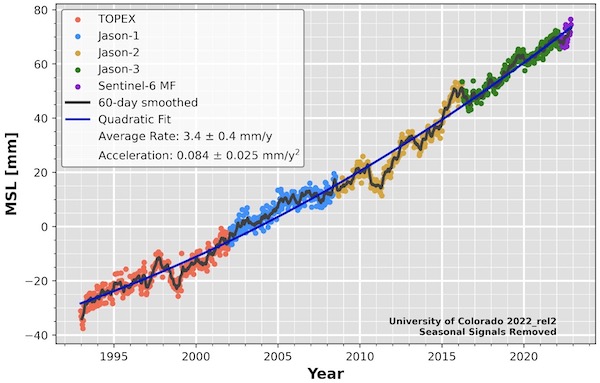
Global Mean Sea Level, measured by satellite, with seasonal signals removed. Source: University of Colorado’s Sea Level Research Group (2022)
2. For completeness: From the IPCC assessment: “The rate of global mean SLR was 1.35 mm/yr (0.78–1.92 mm/yr, very likely range) during 1901–1990, faster than during any century in at least 3000 years (high confidence). Global mean SLR has accelerated to 3.25 mm/yr (2.88–3.61 mm/yr, very likely range) during 1993–2018 (high confidence).” And from this recent paper: “We find GMSL rise in 2050 relative to 2020 will be 16.4 cm higher, with an uncertainty range of 11.3–21.4 cm.”
Current Climate Data (December 2022)
Global impacts, US impacts, CO2 metric, Climate dashboard
Comment Guidelines
I hope that your contributions will be an important part of this blog. To keep the discussion productive, please adhere to these guidelines or your comment may be edited or removed.
- Avoid disrespectful, disparaging, snide, angry, or ad hominem comments.
- Stay fact-based and refer to reputable sources.
- Stay on topic.
- In general, maintain this as a welcoming space for all readers.


