On Wednesday, June 29, the Midpeninsula Regional Open Space District (Midpen) will decide where to allow e-bikes on its 250 miles of trails. Although mountain bikes are permitted on two-thirds of Midpen trails, e-bikes are not allowed. The organization has gotten many requests to allow e-bikes and has recently completed pilots in two of its 26 preserves. The results of those pilots, along with surveys of users on trails that allow e-bikes, a review of scientific literature on the impacts of e-bikes, and a study on the sound emitted by e-bikes have all been written up in a report for the Midpen board. That report will provide context for Wednesday’s 5pm discussion.
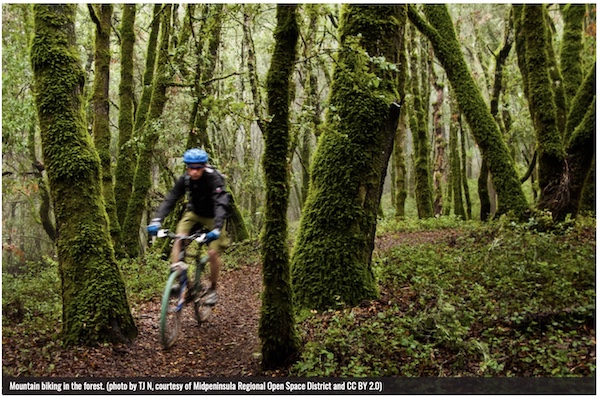
E-bikes that have traditionally been commute vehicles are increasingly being used for recreation. Image source: Midpen
Is access for e-bikes consistent with Midpen's mission, which includes both protecting the natural environment and providing opportunities for “ecologically sensitive public enjoyment”? Were the pilots successful enough that e-bikes should be allowed in those areas going forward? Should e-bikes further be allowed on those trails where non-motorized bikes are permitted, or should they be prohibited barring further study?

Mission of the Midpeninsula Regional Open Space District. Source: Midpen
I will briefly review what I learned from reading the report, and look forward to your comments below.
First of all, the pilots seem to have been pretty successful. They occurred on paved or “improved” (e.g., gravel) multi-use trails in the Ravenswood and Rancho San Antonio Preserves, as shown in purple below.
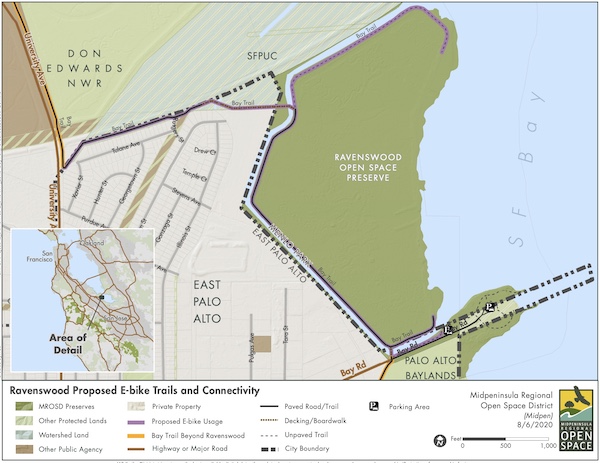
E-bike pilot area in Ravenswood Open Space Preserve. Source: Midpen
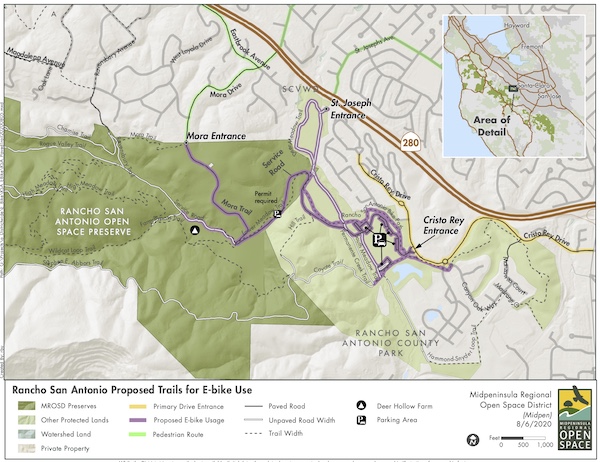
E-bike pilot area in Rancho San Antonio Open Space Preserve. Source: Midpen
The results of the pilots are written up on pages 16-46 of the report. A few speeding incidents involving e-bikes were reported or observed, but the same was true for non-motorized bicycles (page 44). The rates were similar (5.4% vs 3.8%), and the small numbers of e-bikes means it’s hard to deduce much. (Only about 5% of bikes observed were e-bikes.) When people along the trails were surveyed, a large majority (68%) expressed support for Class 1 (pedal-assisted) e-bikes on paved or improved multi-use trails, with fewer (42%) supporting Class 2 e-bikes, which do not require pedaling. The reason for the diminished support seems to be resistance to the fact that the Class 2 e-bikes do not require exercise and/or seem "too much like a motorcycle". (1)

68% of those surveyed in the pilot preserves support Class 1 e-bikes, while only 42% support Class 2 e-bikes. Source: Midpen
This seems very positive, though when you look more closely at the data, the results are less clear. Virtually everyone who was surveyed in Rancho San Antonio was walking, while almost everyone surveyed in Ravenswood was biking.
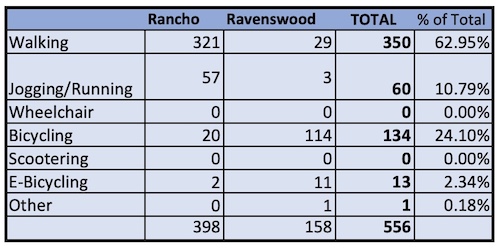
95% of those surveyed in Rancho San Antonio were walking or jogging, while 79% of those surveyed in Ravenswood were biking. Source: Midpen
The survey results show significantly greater support for e-bikes in Ravenswood. Below is a chart showing support for Class 1 e-bikes by preserve.
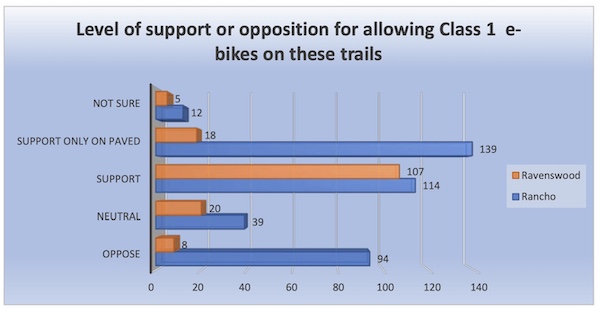
For Class 1 e-bikes, 79% of those surveyed in Ravenswood (almost all cycling) are supportive, while only 64% of those surveyed in Rancho (almost all walking) are supportive, and most of that support is for paved trails. Only 29% of those surveyed in Rancho support Class 1 e-bikes on unpaved trails. Source: Midpen
The differences between preserves are equally apparent for Class 2 e-bikes, which can trigger the motor without pedaling.
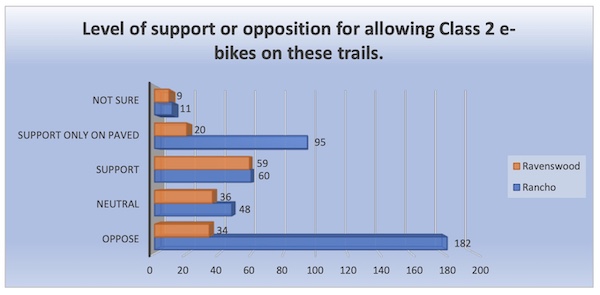
For Class 2 e-bikes, 50% of those surveyed in Ravenswood (almost all cycling) are supportive, while only 39% of those surveyed in Rancho (almost all walking) are supportive, and most of that support is for paved trails. Only 15% of those surveyed in Rancho support Class 2 e-bikes on unpaved trails. Source: Midpen
I do not think it is appropriate to average these two fairly different sets of feedback, as was done in the main section of the report. Instead I think it is more valid to recognize that e-bikes are relatively welcome by cyclists in areas with many bikes, and less welcome by walkers in areas with fewer bikes.
Midpen also sought feedback about Class 1 e-bikes where they have been allowed on unpaved trails. They surveyed visitors to two parks in Santa Clara County that support these bikes on both paved and unpaved trails. Interestingly, the results show similar or less opposition as the pilots, even among non-cyclists. See pages 47-73 of the report.
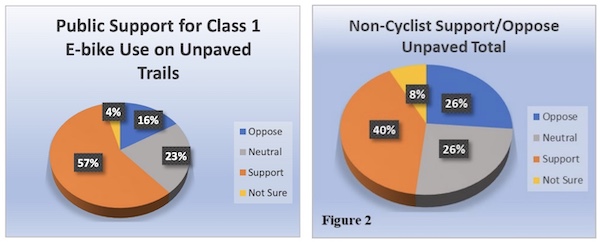
Source: Midpen
These parks had many more e-bikes, 10-12% of all riders. Observational data showed similar levels of speeding across bikes and e-bikes, though anecdotal reports reflected proportionally more incidents with e-bikes.
The very positive survey responses surprised me until I looked more closely at the data and realized that nearly 80% of those surveyed were cyclists.
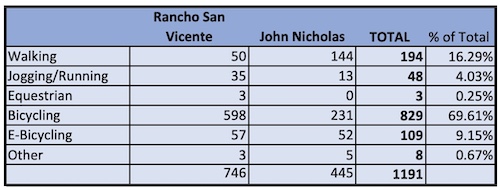
Source: Midpen
Now I’m not sure what to make of them. One thing that seems clear is that cyclists on bike-heavy trails don’t mind adding other cyclists, even on e-bikes, while walkers on bike-light trails are more hesitant. That is no surprise. Since the majority of people surveyed by Midpen (62%) in all four preserves were on bicycles, the results are skewed. In three of the preserves, the large majority of people interviewed (64-90%) were cycling. Only Rancho San Antonio responses are representative of walkers and they are quite different. Just 29% of those surveyed in Rancho support Class 1 e-bikes on unpaved trails.
When Midpen asked for public comment about e-bikes on their web page, over 90% of the comments they got were in favor of allowing e-biking. In board meetings, over 80% of the comments were in favor of allowing e-bikes. But in direct correspondence to the board, over 60% opposed e-bikes. It’s interesting how the responses are so different based on the feedback mechanism. See pages 74-76 of the report.
What do I take away from the pilots and interviews? I believe that e-bikes have not been disproportionately involved in incidents such as speeding to date, they are welcome in bike-heavy preserves, and they are not as welcome in preserves with fewer bikes. But these surveys mainly assess impact on people. What about impact on wildlife and the environment more generally?
A review of scientific literature by the San Francisco Estuary Institute (pages 102-128 of the report) indicates that there are not many studies on the impact of e-bikes in natural areas, and the studies that do exist are often not large enough to be statistically significant. Yes, there is some impact on soil and vegetation, but whether it is meaningfully different from that of non-motorized mountain bikes is not clear and depends on factors like the grade of the trail. Wildlife is initially disturbed by bikes, whether motorized or not, but in some cases animals habituate. For example, deer may initially leave an area when bikes are introduced but then come back within a few years, particularly if their predators are not as keen to come back. The literature is frustratingly inconclusive on the impacts.
Taking another tack, the scientific review asks whether and where e-bikes differ from mountain bikes, so they can look more closely at the differential impact. It identifies a few potential areas of difference: noise, fire risk, conflicts, speed, and miles on trail.
Noise is a potential issue, as described in this specially commissioned study. It found that e-bikes are significantly noisier than traditional bikes, particularly when going uphill. The authors are especially concerned about the higher frequencies that are inaudible to humans but can disturb bats and birds.
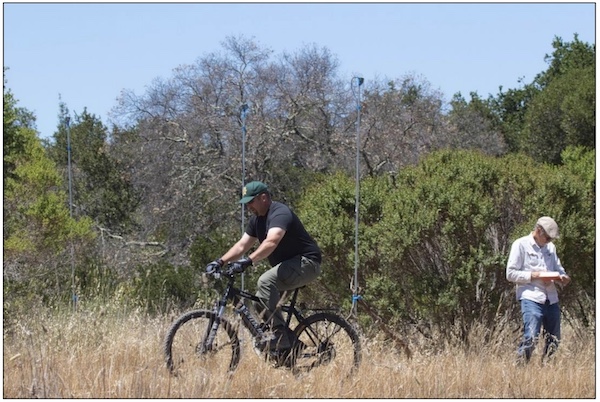
Recording the sound of e-bikes. Source: Midpen
Some of the other differences -- risks of fire, conflicts, greater speed -- may also have an impact. The report finds that “(Battery) fires that ignite mid-ride appear to be much less common, although there are documented cases.” Conflicts in preserves may be somewhat greater with e-bike riders, due to visitor concerns about their impact or perceptions that e-bike riders are “cheating”. Regarding speed differences, few studies have looked at relative speeds in practice, though a small study in Boulder found that e-bikes “traveled faster than conventional bikes in uphill settings (13.8 vs. 12.9 mph) and slower in downhill settings (13.5 vs. 15 mph)”. This may be because they also found e-bike riders to be considerably older.
But in my mind none of the above gets at the real question around impact, which I believe is miles traveled. E-bikes will make more trails accessible to more people, and more miles traveled means more impact. How many more riders will we have? How much farther will they go with a motor? And how much more often will they ride with less tired legs? Studies that quantify this effect are thin. For example, one study found that e-bike riders on Colorado public lands were older, averaging 58 rather than 32, suggesting more riders were able to participate. How many more and how much farther will e-bike riders travel? We don’t know.
I’ll go for a somewhat extreme analogy here to explain why I worry about this more than the other effects. If you look at the impact of oxygen tanks on Everest, yes the tanks make a hiss that might bother some animals (if there were any up there). And yes the tanks allow individuals to move a little faster. And yes they can result in some trash on the mountain. But the big impact is none of those things, it is the sheer volume of people who are now able to go up the mountain because they have access to oxygen.

Photo courtesy of Mário Simoes on Flickr
I wish the report focused more on this issue, the tradeoff of greater access with greater impact. Will e-bikes mean that more distant, quieter areas of a preserve get busier? Will relatively unperturbed areas become perturbed? Will speedy downhill bikers become more common as the uphills get more accessible? Will longer and more frequent bike rides mean more wear and tear on trails? The study says that we simply do not know yet. It is early days for the e-bike market. As a result, the report’s authors strongly recommend “adaptive management” if and when we do open up some trails to e-bikes. We should carefully monitor use and impacts and stay apprised of any new scientific studies, and be prepared to adjust policy accordingly.
The Midpen board members are being asked to weigh in on two questions on Wednesday:
Question 1: Should the pilots in Rancho San Antonio and Ravenswood preserves be considered successful, and Class 1 and 2 e-bikes be allowed on the piloted trails?
Question 2: Should we allow Class 1 e-bikes on all other trails and preserves where bikes are allowed, subject to environmental review; should we continue to prohibit e-bikes in those areas; or should we do a pilot of e-bikes on unpaved trails in select preserves?
My take, given what I have read, is that our policies should distinguish between bike-heavy preserves and bike-light preserves. In the former, such as Ravenswood, it seems appropriate to allow Class 1 and Class 2 e-bikes on paved and improved trails, and to trial Class 1 e-bikes on all trails where bikes are allowed. However, I would be much more cautious about doing this in bike-light preserves such as Rancho San Antonio. In either case, where we do allow e-bikes, we should be especially careful to monitor impacts on the environment and wildlife, which cannot participate in surveys or speak up in meetings. That will require sufficient funding to hire enough field staff. We should also have careful signage about appropriate behavior/etiquette for riders; a method for collecting impartial feedback; and a way to communicate any changes in policy.
I would also encourage the authors of this report to consider presenting their data in a way that doesn’t average feedback across bike-heavy and bike-light preserves, and that doesn’t get so much of its feedback from cyclists.
What do you think?
Update: You can read about Midpen's decision here.
Notes and References
1. Midpen did not ask about, and is not considering allowing Class 3 bikes. These bikes trigger the motor only upon pedaling, like Class 1, but can attain higher speeds of 28 mph. (Class 1 and 2 bikes are limited to 20 mph.) Of the e-bikes observed in the pilot areas, 59% were Class 1, 28% were Class 2, and 12% were Class 3.
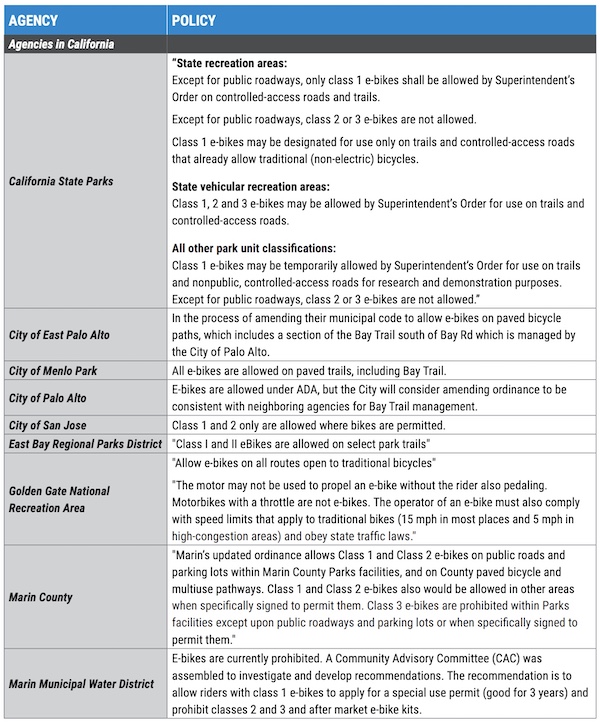
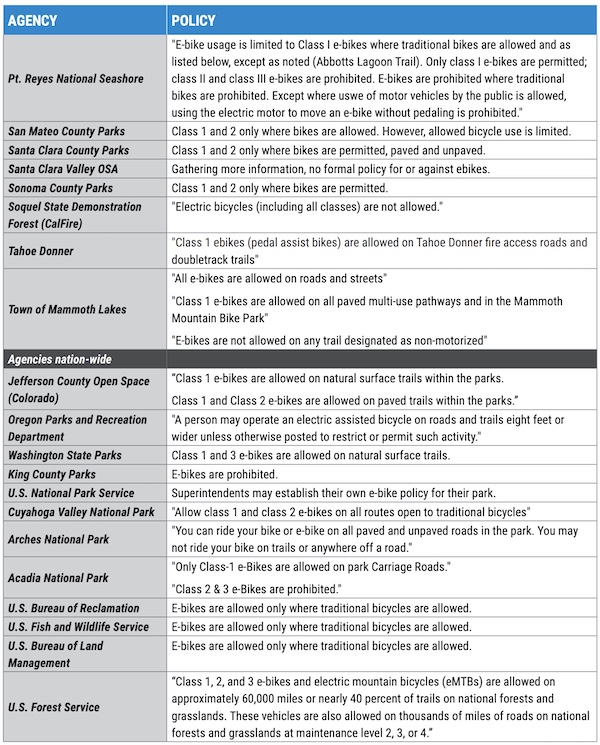
2. Below is a table of e-bike policies in different areas, from the board report.
Current Climate Data (May 2022)
Global impacts, US impacts, CO2 metric, Climate dashboard
Comment Guidelines
I hope that your contributions will be an important part of this blog. To keep the discussion productive, please adhere to these guidelines or your comment may be edited or removed.
- Avoid disrespectful, disparaging, snide, angry, or ad hominem comments.
- Stay fact-based and refer to reputable sources.
- Stay on topic.
- In general, maintain this as a welcoming space for all readers.


