A Snapshot of Grid Mixes across the US | A New Shade of Green | Sherry Listgarten | Mountain View Online |

Local Blogs

A New Shade of Green

By Sherry Listgarten

E-mail Sherry Listgarten

About this blog: Climate change, despite its outsized impact on the planet, is still an abstract concept to many of us. That needs to change. My hope is that readers of this blog will develop a better understanding of how our climate is evolving a...  (More)

View all posts from Sherry Listgarten

A Snapshot of Grid Mixes across the US

Uploaded: Jan 30, 2022
Over the past few days I’ve spoken with several people who are electrifying their homes and cars, and it reminded me how lucky we are to live in California where our grid has pretty low emissions. It makes an extra big difference to switch from gas to electric! But our grid is very different from many other places in the US. This blog post shows snapshots of the grid mix in different parts of the country, to remind us of the challenges we face reducing emissions across the states.


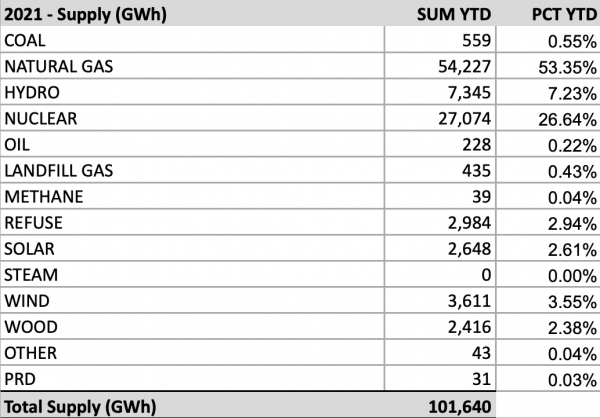
Regional transmission organizations across the US. Source: Federal Energy Regulatory Commission

This post is pretty informal in that I just have point-in-time snapshots of grid mixes from earlier this week. I tried to get mid-day and night snapshots from the main Independent System Operators, shown above, but I couldn’t easily find data for Texas (ERCOT), and my midday snapshots on the west coast end up being afternoon snapshots on the east coast. So this is imperfect, but I hope you will still find it interesting.

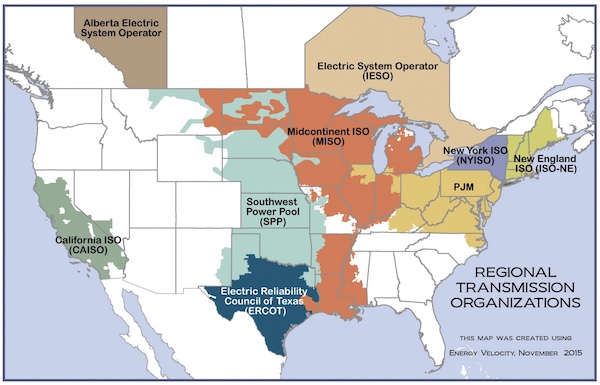
We’ll start with California, which is what most of us are most familiar with. Our grid is usually at least half renewables midday, with the vast majority of that being solar. (1) With an additional portion of nuclear and (currently) a very small amount of hydropower, only about one-third of our power on this winter day was coming from fossil fuels. (Imports are largely gas.) That is fantastic and getting better.


Fuel mix on California’s grid on Wednesday, January 26 at 12:30 pm PST. Source: CAISO

The picture at night is quite different. With the sun having set, you can see that over 70% of our grid is fossil fuel. This is why I encourage people to charge their EVs during the day when possible, and especially to avoid the 4-9pm slot when the grid is dirtiest. One thing that is interesting to me is the emergence of a small slice of battery storage, which is going to get much bigger in the next few years. It’s also interesting to see the potential for geothermal energy, which is reliable and producing nearly half as much energy as wind on this evening.


Fuel mix on California’s grid on Tuesday, January 25 at 8 pm PST. Source: CAISO

New York is an interesting comparison to California. It is also a very environmentally conscious state, and they are working to electrify transportation and buildings much as we are. What does their power supply look like?


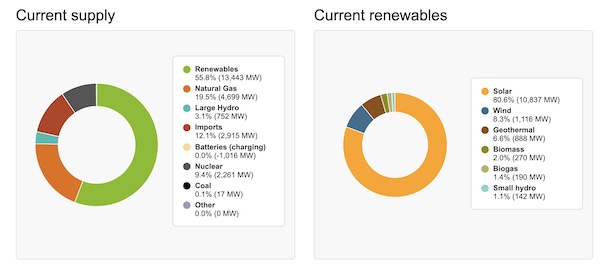
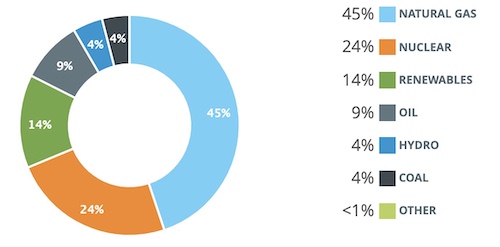
Fuel mix on New York state’s grid on Wednesday, January 26 at 3:30 pm EST. Source: NYISO

What I notice is that there is virtually no solar or wind, and if it weren’t for a very large amount of nuclear energy and hydropower, their grid would be nearly all fossil fuel. Luckily the east coast doesn’t seem to be subject to the droughts that we are having out west.

The other interesting thing is that at night (shown below) the mix is not that different! In fact, in this case the grid at night has slightly lower emissions because demand is lower so less fossil fuel is needed. While flexible demand is essential for California’s solar-heavy grid, it seems to matter much less for New York. I wonder why they have so little wind and solar power, and if/how that is changing.


Fuel mix on New York state’s grid on Tuesday, January 25 at 11 pm EST. Source: NYISO

You can see on the map at the beginning of this post that the New York Independent System Operator (ISO) is bordered to the northeast by the New England ISO and to the southwest by the so-called PJM ISO (2). Do you think these grid mixes look similar to that of New York?

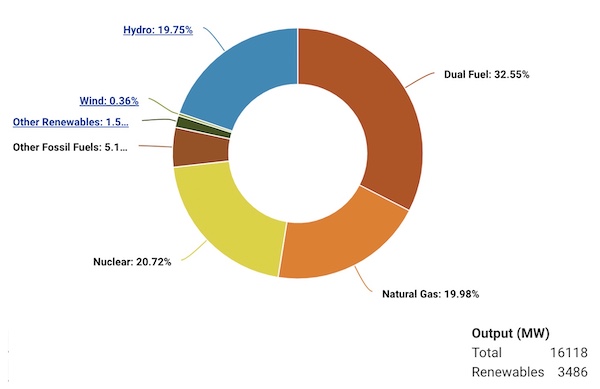
It turns out that both have substantial amounts of gas and nuclear energy, but they differ in other ways. New England, shown below, has very little hydropower and adds a large amount of oil to the fossil gas. Its diverse but small smattering of low-emission sources leave it with a grid that is nearly two-thirds fossil at the time that I looked.


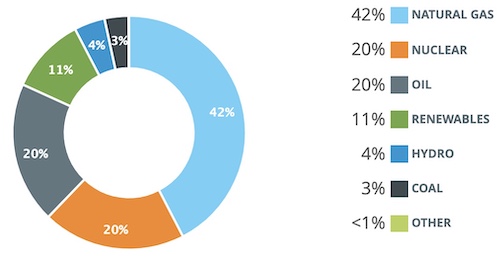
Fuel mix on New England’s grid on Wednesday, January 26 at 3:30 pm EST. Source: ISO-NE


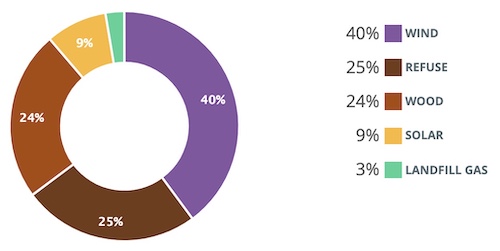
Renewable mix on New England’s grid on Wednesday, January 26 at 3:30 pm EST. Source: ISO-NE

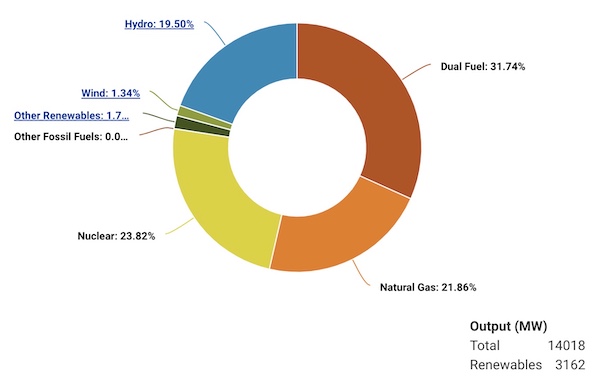
At night the grid is somewhat cleaner because demand is lower so less oil is used. (The renewable mix doesn’t change much from what it is during the day, so I am omitting that chart.)


Fuel mix on New England’s grid on Tuesday, January 25 at 11:30 pm EST. Source: ISO-NE

What about PJM, with Pennsylvania, Virginia, and Ohio. (2) Are you thinking coal? If so, you would be correct. In fact the grid seems to be about one-third coal, one-third gas, and one-third nuclear on this winter afternoon. Nuclear is pretty much the only source of low-emission electricity. You can see also that there is an enormous amount of electricity on this grid, about 5x that of California and 7x that of New York. It is very big and very dirty.


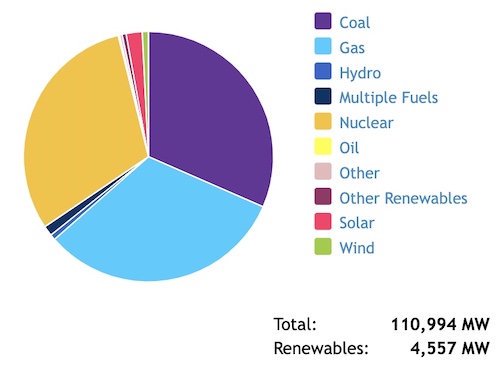
Fuel mix on PJM grid on Wednesday, January 26 at 3:30 pm EST. Source: PJM

At night it doesn’t look much different.


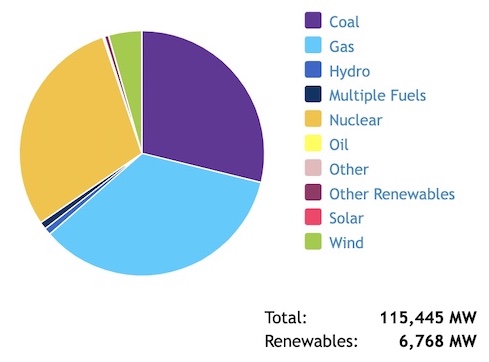
Fuel mix on PJM grid on Tuesday, January 25 at 11:30 pm EST. Source: PJM

You can see from the New York, New England, and PJM operators how crucial nuclear energy is for reducing electricity emissions. New York has pushed out coal by adding more gas and hydropower, as shown in these excellent New York TImes graphics. In New England they largely replaced coal with gas. PJM still has a massive amount of coal left. What have they got up their sleeve besides gas as they move away from coal? Is there an answer other than gas?

There are two remaining operators to look at, both in the midwest. You might think they would look similar to each other, since they are adjacent and span much of the length of the country. And the mixes are very similar.

The Southwestern Power Pool, centered around Kansas, Nebraska, and Oklahoma, has an enormous amount of wind, but only a small amount of nuclear and little else that is fossil-free. With about twice as much coal as gas, their grid is far from clean, though as wind and to some extent gas keep pushing coal out, it is getting cleaner each year. (The night-time mix was almost identical, so I am not including a picture here.)


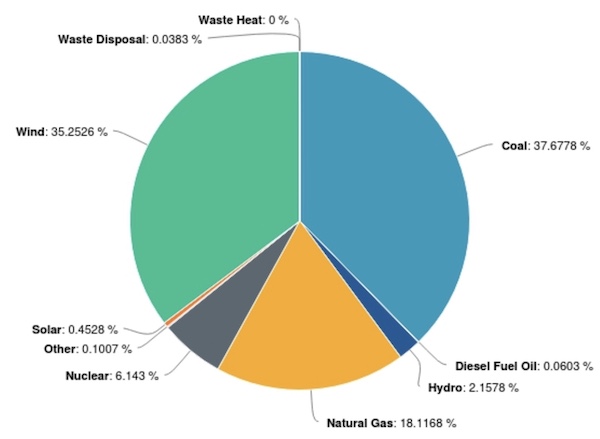
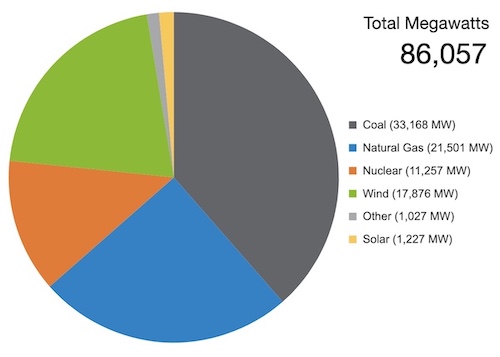
Fuel mix on Southwest Power Pool’s grid from Wednesday, January 26 at 2:30 pm CST. Source: Southwest Power Pool

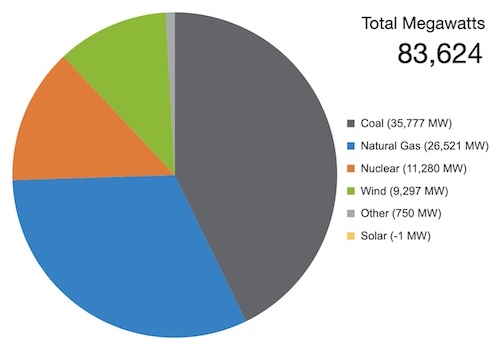
The Midcontinent ISO, stretching from Minnesota in the north to Louisiana in the south, looks very similar, but with less wind and more nuclear.


Fuel mix on the Midcontinent ISO’s grid from Wednesday, January 26 at 2:35 pm CST. Source: Midcontinent ISO

I wonder, though, if the wind is more variable in the part of the country spanned by this operator. When I looked in the evening, the wind had dropped by half and gas had picked up the slack.


Fuel mix on the Midcontinent ISO’s grid from Tuesday, January 25 at 10:10 pm CST. Source: Midcontinent ISO

This chart from the EPA confirms that the MISO territory has higher emissions than the SPP territory.


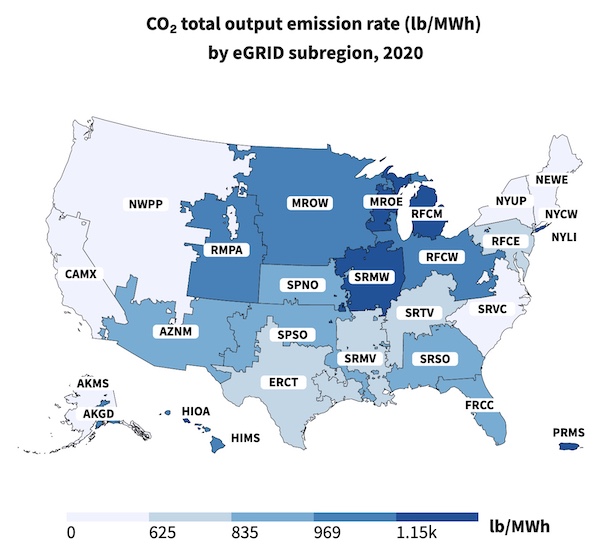
Emissions rates in grids across the country. Source: EPA

What are my takeaways from this exploration? I’m curious what yours are, but mine are:

1. California is doing a terrific job cleaning up its grid, especially during the day, and we should take advantage of that by electrifying and shifting our demand to the daytime hours when possible.

2. The bigger grids (e.g., PJM and MISO) seem to be the dirtiest grids. How hard will it be for them to develop renewables at the scale we need? And how much of a role can efficiency (e.g., building codes) play on these power-hungry grids?

3. There is surprisingly little solar in the rest of the country. I don’t understand why. The sun shines everywhere and solar is pretty inexpensive. Is land the problem? Or managing the variability?

4. There is surprisingly little hydropower in some of the ISO’s in the north. I would like to better understand why, especially given the potential for imports from Canada.

5. Nuclear energy is currently essential for keeping grid emissions down in much of the country.

6. If you click through to the EPA in the chart above, you will see that New York’s grid emissions were less than half that of California’s in 2020 (234 vs 513 lb/MWh). There is something to be said for low-emission energy that works at night! Offshore wind is a good bet for California in that regard.

7. I worry about how we are going to avoid replacing coal with gas since many of the operators seem to have little experience with the more variable renewables. California is fine-tuning its approach with different types of storage while many other states are barely at the starting line on this.

What are your takeaways, questions, or observations?

Notes and References
1. This does not include the “behind the meter” rooftop solar power that is consumed when it is generated.

2. PJM stands for Pennsylvania, New Jersey, and Maryland, though PJM has expanded to cover parts of 13 states since it was founded in 1956.

3. This overview is missing large portions of the country, from the Pacific Northwest, which should be (and is) swimming in hydropower, to the Southeast, which should be (but is not) swimming in solar.

Current Climate Data (December 2021)
Global impacts, US impacts, CO2 metric, Climate dashboard

Comment Guidelines
I hope that your contributions will be an important part of this blog. To keep the discussion productive, please adhere to these guidelines or your comment may be moderated:
- Avoid disrespectful, disparaging, snide, angry, or ad hominem comments.
- Stay fact-based and refer to reputable sources.
- Stay on topic.
- In general, maintain this as a welcoming space for all readers.

Comments that are written in batches by people/bots from far outside of this community are being removed.
Community.
What is it worth to you?

Comments

Posted by Eeyore (formerly StarSpring), a resident of Adobe-Meadow,
on Jan 30, 2022 at 8:47 am

Eeyore (formerly StarSpring) is a registered user.

Sherry,

I hope you are collecting all this information for inclusion in a book. It is a huge amount of detailed work that deserves more than an ephemeral blog entry.


Posted by Sherry Listgarten, a Mountain View Online blogger,
on Jan 30, 2022 at 9:50 am

Sherry Listgarten is a registered user.

I so appreciate that you read and enjoy the blog! I think I will leave the books to the experts though (!)

Speaking of which... A bunch of grid experts are engaged in a years-long debate right now about the future grid mix in the Midcontinent ISO, which you can see from this post is a large grid with a lot of coal. The question is whether they will be replacing coal with gas or renewables. I wrote about that some almost a year ago, and plans continue to be exchanged. This is where the Sierra Club, for example, is investing a lot of time and effort to ensure the plan reduces our reliance on fossil fuel as much as possible. You can see from the comments that the public is participating as well, generally advocating for cleaner power.

This is an example of an important way that our power grid gets cleaned up -- nitty-gritty debates in a Public Utilities Commission about power plant development.

Hopefully we can all gain some basic knowledge so that we can also participate in and push forward this massive energy transformation across the country.


Posted by KOhlson, a resident of Old Palo Alto,
on Jan 31, 2022 at 2:11 pm

KOhlson is a registered user.

As always, great stuff. Some personal observations. We drove across country last year. At least on I-80, you can tell when you get to Nebraska, aka The Wind Turbine State. It's my understanding that wind is very much a part of all the Plains states, so there must be some other reasons why the others had few, if any wind turbines. As we drove along the Erie Canal, it's apparent there is plenty of water. I'm not an expert, but I think the missing ingredient for hydroelectricity generation is verticality. And villages seem to be everywhere, which dams would displace. Finally, when visiting friends in Maine, their guest house had 44 (!) PV panels on the roof. This is almost completely for heat in the winter, when the sun is very low in the sky, if it is even out at all. They're looking into a small wind turbine, but can't seem to find a contractor.


Posted by Ronen, a resident of Menlo Park: Suburban Park/Lorelei Manor/Flood Park Triangle,
on Jan 31, 2022 at 2:21 pm

Ronen is a registered user.

Sherry - I'm not sure if you're familiar with this website, but they also provide time of day information for grid carbon intensity throughout the day:

Web Link

With respect to lack of solar in the rest of the country, I suspect that some of that has to do with the time at which your data was collected and the latitude of the regions you looked at. 3:30 PM in New England is almost night time :)

To me, whether a generation source is considered renewable is of no consequence. What I care about is carbon intensity - which is why I am alarmed about the pending shut down of Diablo Canyon. We can argue about nuclear when the grid is 100% carbon free.

Finally, our family is almost fully electrified. Just need to replace that water heater and the furnace - both of which we'll do in the next few years. We've taken to using major appliances (and charging the EV) during morning hours to further reduce carbon intensity.

We're making progress, but we could clean up the grid even faster.


Posted by Mondoman, a resident of Green Acres,
on Jan 31, 2022 at 5:58 pm

Mondoman is a registered user.

The California graphs at the beginning consider "Large Hydro" not a renewable. I understand the politics behind that silly convention, but at least here we are encouraging fact-based discussion...
Also, a blank pie slice should be added to show the 1000MW of "extra" supply being drawn off to charge batteries, as that is real supply.


Posted by Sherry Listgarten, a Mountain View Online blogger,
on Jan 31, 2022 at 9:22 pm

Sherry Listgarten is a registered user.

@Ronen, that link is amazing!! I have got to spend some more time on it and see what I find. The wind layer is fun to look at.

What really gets me is the difference between the Southwest Power Pool and the Midcontinent ISO (MISO). Very similar potential from what I can tell but an enormous difference in emissions. I am glad there is so much debate during the MISO planning discussions.

BTW, that's great to hear about your electrification progress.

@KOhlson: Wow, how did they even fit 44 panels?! I wonder if they looked into geothermal?

@Mondoman: FWIW, I think a blank slice would be misleading because the chart shows the proportions of what is on the grid and the battery charging doesn't change that. IMO the annotation listing the loss of 1GW for charging the batteries seems right. But YMMV.

Anyway, thanks for the great comments, and hopefully everyone will check out the link that Ronen shared...


Posted by KOhlson, a resident of Old Palo Alto,
on Feb 1, 2022 at 12:07 pm

KOhlson is a registered user.

The guest house in Maine is perhaps 1500 sf? The entire half of the roof that faces south is covered in panels. I did not ask them about geothermal, but I suspect the answer would have been "Ledge." Their property is situated on this type of rock, which is seemingly slightly harder than stainless steel. FWIW, they have an additional 12 panels on the main house, which is where they live year round. They said they have 3 ways to heat the main house, and it takes a lot of juggling throughout each day to get it right.


Posted by Donald, a resident of South of Midtown,
on Feb 1, 2022 at 2:55 pm

Donald is a registered user.

Sherry,
This is great information. I would love to see you investigate and report on various battery storage technologies and compare their economic and environmental pros and cons, both for individuals and for large grid-scale storage.


Posted by TimR, a resident of Downtown North,
on Feb 1, 2022 at 3:58 pm

TimR is a registered user.

California may be doing a good job, but we are also near the bottom in terms of electricity used per capita (ie, we use less than residents and businesses of most other states). Things are a little bit harder in a state where, eg, the winters aren't fit for human habitation (without massive amounts of energy). Heck, even clearing snow from solar panels must be many times more difficult than just clearing them of dust. Patting ourselves on the back is fine, but we also have to realize than many other states have a much more difficult job, in "cleaning up" their grids.


Posted by Sherry Listgarten, a Mountain View Online blogger,
on Feb 1, 2022 at 8:09 pm

Sherry Listgarten is a registered user.

@Donald, storage is definitely a hot topic! One thing to keep in mind is that batteries are just one of many forms of storage. Compressed air is a great example of non-battery storage, coming soon to California to provide longer-duration (8-12 hour) storage.

@Tim, California is definitely lucky to have a (mostly) temperate climate, but I think you also need to give the state credit for efficiency standards and clean-energy policies. Vox has a good writeup on data showing it's not just climate. Ironically some of the cleanest states are farthest north. They have ample hydropower, unlike drought-stricken CA. Take a look at the map Ronen shared. What's up with Nevada, which has a climate similar to ours? Or look at Florida. Every place is different, for sure, but between efficiency standards and leveraging local resources, I think many more places could be doing much more with what they have, but they haven't wanted/needed to.


Posted by Former PA resident, a resident of another community,
on Feb 1, 2022 at 9:42 pm

Former PA resident is a registered user.

Thanks for another informative post, Sherry. A few thoughts in response:

- Regarding the high oil share in ISONE, that's probably not a representative number. If I recall, the NE region was dealing with some extremely cold weather last week when you took your "snapshot." When that happens, the gas supply gets quite tight (everyone's using it for space heating), which drives gas prices *way* up, which causes the grid operators to call on some of the more expensive/inefficient generators in their supply stack (i.e., oil). On a more temperate day, oil would make up only a very small % of their power supply.

- I suspect the reason you don't see more solar in the mix across the country is partly due to what @Ronen said -- there's little sun available at 3:30 pm, particularly in the winter. It would be interesting to take snapshots of these grid mixes at, say, 1 pm, and in all four seasons of the year. I know the other parts of the country don't have nearly as many solar MWs installed as CA, but they're at least starting to move in that direction (particularly the SE and the desert SW, whose mixes aren't captured in this post). It would be interesting to look at the installed MWs of different types of resources in each region over time. I think LBNL may publish something along those lines. As for why these regions were slower to get on the solar bandwagon, it's due to the fact that until the past few years solar was still too expensive in these areas. Aside from the desert SW, all of the other parts of the country have much lower levels of solar irradiance than CA, which means a MW of solar installed there will produce far fewer MWhs of energy, which means far less $$$ for the developer. Fortunately solar prices have dropped so much in recent years that it now pencils out even in the northern parts of the country.

- Finally, I wholeheartedly agree with your takeaway #1 -- charge your EVs and use large appliances during daylight hours in CA!!!


Posted by Former PA resident, a resident of another community,
on Feb 2, 2022 at 10:06 am

Former PA resident is a registered user.

*Update -- I just looked at the ISO-NE power mix (1 PM ET on 2/2/22) at the oil share is down to 3%.
Web Link


Posted by Sherry Listgarten, a Mountain View Online blogger,
on Feb 2, 2022 at 10:36 am

Sherry Listgarten is a registered user.

@Former, thanks for the tips. I looked at ISO-NE's 2021 energy report and found this summary of the annual use. You are right, oil is minimal and the time I measured was an anomaly!


I like your suggestion of looking at installed MWs as well. There were definitely some limitations to this "poke around" analysis.


Posted by Chris, a resident of Woodside High School,
on Feb 2, 2022 at 1:16 pm

Chris is a registered user.

Great info and writeup!

If I may make a suggestion, try using the same color=energy source across all graphs.
eg. sometimes coal is brown, sometimes coal is blue, other times it is purple.

that consistency will help make the charts even more clear.


Posted by Darbat, a resident of Woodside: Woodside Glens,
on Feb 4, 2022 at 12:07 pm

Darbat is a registered user.

Thanks for another amazingly well researched article on the environment. I constantly forward your blog to others.

Would you be open to speaking to a group of Portola Valley, Woodside and Menlo Park residents? Topic: Why you are passionate about the work you do and what you recommend we do to reduce our carbon footprint. If so, please contact me [portion removed]. Thanks!


Posted by Sherry Listgarten, a Mountain View Online blogger,
on Feb 4, 2022 at 5:16 pm

Sherry Listgarten is a registered user.

@Chris: I could not agree more! Unfortunately I just took screenshots from the pages of the various operators and did not make my own charts. I apologize that these are hard to compare.

@Darbat and others: Just FYI, if you want to reach me, there is a link to email me at the top of every post, just under the green banner and my name. I will reply, and also remove your contact info from this (public) post. Thank you for the kind words...


Posted by chris aoki, a resident of Old Mountain View,
on Feb 8, 2022 at 6:35 pm

chris aoki is a registered user.

Thanks for posting the nice pie charts, which provide a good quick
comparison of the power source distributions in other parts of the
country.

FWIW, the following URL provides an approximately real-time line graph
of power source distributions in the jurisdiction of the Bonneville Power
Administration (BPA).

Web Link

Unsurprisingly, the vast majority of BPA's electrical power is supplied
by its prolific hydroelectric dams. So far, at least, their output is not
affected by droughts like California's.


Follow this blogger.
Sign up to be notified of new posts by this blogger.

Email:

SUBMIT

Post a comment

On Wednesday, we'll be launching a new website. To prepare and make sure all our content is available on the new platform, commenting on stories and in TownSquare has been disabled. When the new site is online, past comments will be available to be seen and we'll reinstate the ability to comment. We appreciate your patience while we make this transition..

Stay informed.

Get the day's top headlines from Mountain View Online sent to your inbox in the Express newsletter.