This value, called the “social cost of carbon”, is meant to reflect the aggregate costs and benefits of adding one ton of carbon dioxide to the atmosphere. If sea level rise results in loss of property, that would be a cost to account for. If warming temperatures increase agricultural yields, that would be a benefit to account for. The areas evaluated by the social cost of carbon include impacts to human health, energy costs, agricultural impacts, property loss, worker productivity, and land use. It is a wide-ranging analysis, and one that must look far into the future since carbon dioxide stays in the atmosphere for centuries. In a nutshell, the social cost of carbon specifies how much it is worth it to us today to prevent damage to future generations from one additional ton of carbon dioxide in the atmosphere.
Estimates for this cost have ranged widely. The Obama administration took a first stab at evaluating this number in 2010 ($23/tCO2e), then again in 2013 ($43/tCO2e), ending with a cost of $52/tCO2e. A history of the social cost of carbon by CarbonBrief shows that the use of this cost has withstood several lawsuits, including one in Minnesota involving coal power (this is worth a read, and maybe its own blog post) and another from a refrigerator company unhappy with new efficiency standards.
When the Trump administration took over, it aimed to dismantle environmental regulations. It couldn’t eliminate the use of the social cost of carbon, so it opted instead to modify it to a negligible $1-$7/tCO2e using what most economists generally say were very questionable assumptions. (2) The Biden administration on its first day reset the value to $52/tCO2e and set up a working group to incorporate the latest science and data in establishing a new value. The updated social cost of carbon is due out later this month, so I want to give you a look at the work that is going into calculating it.
The valuation of the social cost of carbon involves a few different components:
1. Socioeconomic modeling. How will socioeconomic factors like population, income, and emissions evolve over the coming centuries?
2. Climate modeling. How will climate metrics like sea-level, temperature, and ocean pH be affected by the additional CO2 in the atmosphere?
3. Damages modeling. How will human health, agricultural yields, property and land, energy use, and more be impacted by the changes in climate, and how do we assess the economic costs or benefits?
4. Discount modeling. How do we trade-off the value of future impacts with the value of money today? If we are going to cause (say) $100 worth of damage to future generations, what is it worth spending today to avoid that? (3)
The first model that combined these different components, aka an “integrated assessment model”, was developed by Nobel Laureate William Nordhaus in 1990, the DICE model. Since then many other models have been developed, such as the PAGE model and the FaIR model. (4) These models are typically run many times with different inputs to get a range of values. A central value is what has been used for the social cost of carbon.
The social cost of carbon is a very influential value, not just in the United States but also in other countries that use it. It is important that it be grounded in the best science. In 2017 the National Academy of Sciences took a look at the integrated assessment models and recommended a number of areas for improvement. They suggested particular updates to the science behind the model (i.e., improved socioeconomic, climate, and damage estimates and discounting methodology). They also advocated for transparency around the calculations and assumptions used, and special attention to characterizing uncertainty throughout. It is also critical to have regional and sub-regional data since this data can be highly localized; applying averages can be very distorting. Since that report, teams of scientists have been working to improve the cost calculations, particularly in the last year since Biden set up a new Interagency Working Group to update the cost.
A report issued a few months ago by scientists from Resources for the Future and top universities reflects some of the new findings. In particular, they update the socioeconomic model, the temperature rise estimate, and the discounting methodology. (They leave much of the climate and damage modeling as-is.)
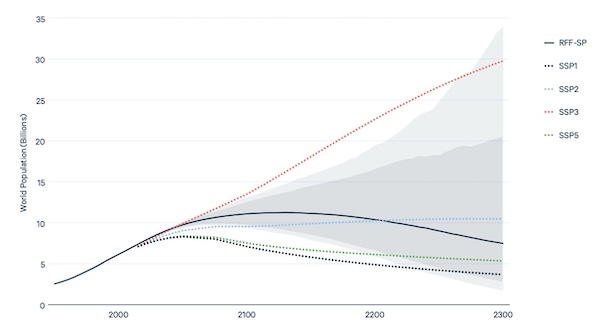
This team re-evaluated the socioeconomic modeling using newer data and input from experts, then compared their results with calculations from organizations like the United Nations or the IPCC that have used similar models, making sure to clarify the ranges of uncertainty. For example, their estimates for population growth are shown as a solid black line below, along with the 90% and 98% confidence intervals in dark and light grey shading, respectively. Estimates used in IPCC reports are shown with dotted lines.

Global population estimate through 2300. The solid black line is the estimate in question, the others are estimates used by the IPCC reports. Dark grey shading represents the 90% confidence interval, light grey the 98%. Source: Resources for the Future paper (2021)
They revise GDP growth, emissions, and temperature rise as well. (The latter has been consistently underestimated in the existing models.)
They also take a careful look at the discount rate. The time periods involved in this calculation are so long that small changes in the discount rate result in big changes to the social cost of carbon. For example, today’s cost of $52/tCO2e is based on a 3% discount rate. If a 2% rate were used, the cost would be $125/tCO2e. The discount rate can be difficult to think about, but here are a few things to know about it. (You can also read David Roberts’ fun overview here.)
- When GDP is growing quickly, the discount rate is higher -- we are less willing to pay money now to avoid future damages. The thinking is that $100 is worth more now than it will be to the wealthy people of the future. It is better to save the money now and make the future people wealthier so they are better able to address the damages. But that thinking is not without flaws.
- There are regional differences. Wealth doesn’t always accrue where it’s needed. Today we see small island nations and hot equatorial regions with little ability to adapt to their rising seas and drying climate.
- There is substantial uncertainty around GDP growth. That uncertainty tends to lower the discount rate. It also suggests that the discount rate itself should be probabilistic.
- Damages can compound. A simple example is a climate “tipping point”, which accelerates climate change once it happens. Early action on climate can help to avoid a compounding effect that is much harder for future generations to handle.
- When there is more wealth, damages tend to be higher. So as the world gets wealthier, damages will increase (all other things being equal).
Some economists argue that the discount rate must be zero, saying that we are ethically compelled to value future generations equivalently to our own. But most come down to a value between 1% and 2%. This team of economists felt it important that the discount rate be probabilistic to account for the uncertainty in GDP growth.
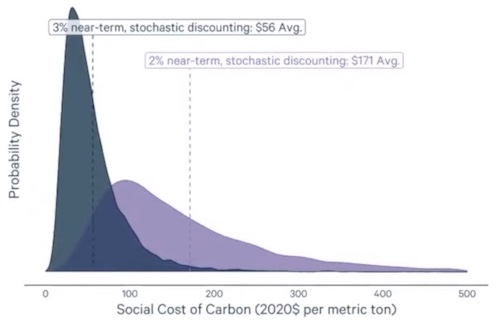
When they combined their updated models with the climate model from FaIR and the damage model from DICE, they find a mean social cost of $61/tCO2e when using a (probabilistic) discount rate that starts at 3%, and a cost of $168/tCO2e when starting at 2%.

Estimates for the social cost of carbon (probability distributions plus means). Source: Resources for the Future paper (2021)
Economists from the Climate Impact Lab and elsewhere are working on other parts of this calculation, particularly the costs of climate impacts on human health (e.g., mortality), productivity, agriculture, and energy use. They aim to evaluate these damages using a “bottom-up” approach, creating models based on observed experience. Economist and Climate Impact Lab affiliate Tamma Carleton explains: “My approach, and I think increasingly the field is moving in this direction, is to leverage historical data to understand how the climate has shaped societies and economies in the past, and to use that evidence to inform the future. We know that is imperfect. There are likely to be things that happen under 4 degrees C of warming that we cannot see in historical data. But my philosophy has been understanding actual observed, realized life in history and economic output is better than guessing.”
Carleton and others recently published a very interesting report on how climate change impacts energy use (with a great presentation here).
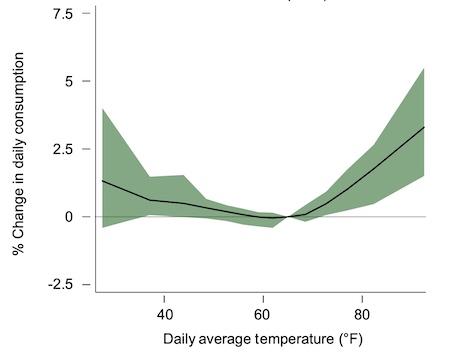
We have generally understood that energy costs will increase as the earth warms. Although less heating fuel is needed, more air-conditioning is needed, and the extra cost for cooling exceeds the saved heating costs given the large population in warmer areas. This chart shows electricity use (only) on warmer or colder days in California. We cool more on warmer days.

Residential electricity consumption in California varies by outdoor temperature, with shading representing the 95% uncertainty range. Source: Tamma Carleton slides showing 2015 Auffhammer result
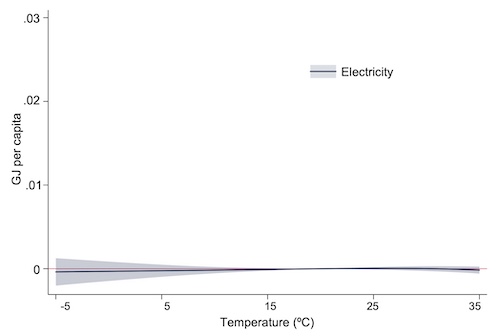
However, the new report finds that when looked at globally, electricity use is almost invariant to temperature.

Global electricity consumption does not vary with outdoor temperature. Shading represents the 95% uncertainty range. Source: Tamma Carleton slides (2021)
The reason is simply that most people are too poor to afford effective adaptations. Only as people become wealthier are they able to use energy to adapt to temperature differences.

Only the wealthy can afford to use electricity to adapt to temperature change. Shading represents the 95% uncertainty range. Source: Tamma Carleton slides (2021)
Other fuels, generally used for heating, show this same pattern, though not quite as starkly.
The conclusion this report draws is in my opinion incredibly depressing. If you look at regional changes in temperature and regional changes in income, and use those to calculate energy use as temperatures rise, energy spending goes down, even when you account for increasing global wealth and adaptation. That seems like a good thing until you realize that the reason for the lower energy bills is that much of the world simply cannot afford to adapt to the warmer temperatures. Even as late as 2100, the model shows a minimal response of energy use to warming in India, sub-Saharan Africa, and Brazil. (5)
This same team looked at the impact of climate on mortality, and using the same localized approach, they see much greater mortality per degree of warming than prior studies. Regional differences matter, and applying average growth or climate indicators across broad regions as previous models did is much less accurate.
It is very disconcerting to listen to economists talk about these models, which predict real-life impacts of climate change around the world. There is a lot of compelling work happening, but when you step back from the math and think about the implications on people, it is a stark reminder of what we are facing. The Resources for the Future report concludes that we will see only a 60% reduction in emissions by 2100 and a 3C rise in temperature. Stanford professor Marshall Burke warns that updated estimates show that “within a few decades mortality from climate change could approach the mortality from COVID that we saw over the past year”. What about the costs and misery of migration and war? On top of that, you wonder if the one billion marine animals that were killed in the heatwave in the Pacific northwest last year, or the three billion animals that were killed or injured in the Australian wildfires even show up as a “cost”. How do you value biodiversity? The models tend to focus on what is knowable or what we have experience with.
And yet we will surely have the fossil industry and appliance manufacturers and more pushing back again, along with their allies in government. So, look for the updated “social cost of carbon” to be released in the next few weeks. Today it is $52/tCO2e. What will the new value be? And how long will it take for interested parties to sue the government over it and block or delay its deployment? Such is the world we live in right now.
Notes and References
1. Beginning during the Reagan administration, US policy has to do undergo a cost-benefit analysis. How do the costs of the policy compare with the benefits to the American people? The plaintiffs in this case (the Center for Biological Diversity, along with many states, the Sierra Club, Environmental Defense Fund, and NRDC) argued that the National Highway Traffic Safety Administration had not done a suitable cost-benefit analysis because it set the cost of the emissions to an “arbitrary and capricious” value of zero.
2. The Trump administration measured only domestic impacts rather than global impacts, and assigned a very high discount rate of 7%. (Most economists think it should be in the 1-3% range.) It is in Americans’ interest to evaluate global impacts because we want other countries to do the same. If all countries cover only the domestic impacts, then the impact of most emissions will never be compensated for.
3. David Roberts has a great explainer on discount rates. He includes two statistics to illustrate this rate. “If we have a discount rate of 3 percent — which is a fairly representative rate in economics — and we face $100 of climate damages in 2100 (roughly 87 years from now), it is worth about $7 to us to avoid it.” And also: “Imagine climate change were on track to cause $5 trillion ($5,000,000,000,000) in damages by the end of the century. That’s an unthinkably large number. (Go ahead, try to think about it.) And it represents unthinkable suffering. But at a discount rate of 3 percent, it would be worth just $382 billion to us today to avoid it. For perspective, that’s a little more than half the annual U.S. military budget (in 2012).” He points out that at a 5% discount rate, it would cost only $72 billion to avoid the $5 trillion in damages.
4. DICE stands for Dynamic Integrated Climate-Economy, PAGE stands for Policy Analysis of the Greenhouse Effect, and FaIR stands for Finite Amplitude Impulse Response.
5. The model does not incorporate the impact of technical improvements that are not correlated with increases in income. The economists are still considering how best to do that in a quantitative, bottoms-up manner (e.g., using relevant precedents).
6. Some of you may be wondering how it is possible to work with a number for which there is so much uncertainty. One of the scientists working on this, University of Chicago’s Milton Friedman Distinguished Service Professor in Economics Michael Greenstone, was clear about this when he spoke during a presentation: “Uncertainty doesn’t mean we don’t do anything. Uncertainty pumps up what we should do.”
Current Climate Data (November 2021)
Global impacts, US impacts, CO2 metric, Climate dashboard
Comment Guidelines
I hope that your contributions will be an important part of this blog. To keep the discussion productive, please adhere to these guidelines or your comment may be moderated:
- Avoid disrespectful, disparaging, snide, angry, or ad hominem comments.
- Stay fact-based and refer to reputable sources.
- Stay on topic.
- In general, maintain this as a welcoming space for all readers.
Comments that are written in batches by people/bots from far outside of this community are being removed.


