A few months ago I started looking at our electricity use. I’ve been tracking it on a monthly basis since moving to our current house ten years ago. Here’s what it’s looked like:

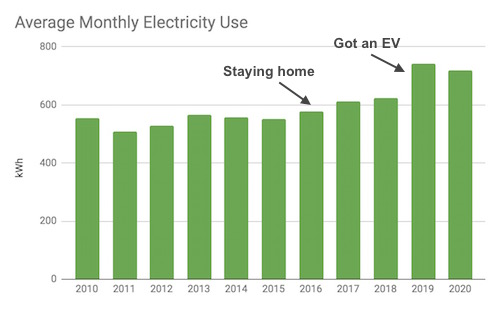
Average monthly electricity use over the years for our 2100 sf house
You can see it’s pretty much going in the wrong direction. It was stable at around 550 kWh/month for a while, then went up to around 625 kWh when I left my job and started staying home in the middle of 2016. Getting an EV at the end of 2018 caused it to go up by another 125 kWh/month.
Is this bad for the planet? I used to think no, since Palo Alto has green electricity. But now I understand that efficiency matters even when you have clean power. One reason is that we are going to be using a lot more electricity in the future, as cars and heating become electrified. To keep our costs down and reduce pressure on the grid, we need to use less electricity when we can. A second reason is that clean energy is harder to come by at certain times, especially evenings and nights in California. Palo Alto has hydropower supplies that can shift to these periods, but the more we can save when the grid is dirtier, the more of that nicely timed hydropower Palo Alto can make available to other places, reducing our costs while making the grid cleaner.
So last year I set a goal to decrease our electricity use by 10%. I started by playing around with the meter to figure out what was causing most of the use. I wrote about that here, along with the ensuing project to replace the halogen lights with LEDs. (I’d already replaced the incandescents.) It took a few hours to figure out what to order and, later, to install them, but it wasn’t too bad. To my surprise, one of the strange halogen fixtures in the kitchen works much better now, maybe because the load is lower. On the downside, one of the hallway lights no longer turns on reliably when it’s dimmed, though it’s fine if I dim it after I turn it on. In general, we don’t notice the change, we have lights just like we always have, just as bright.
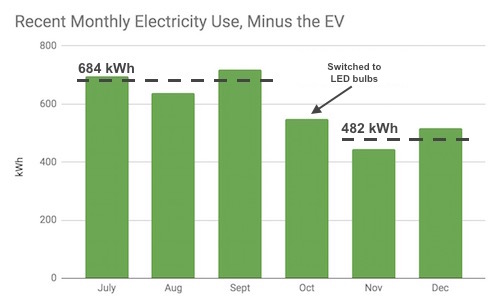
The real question is, how has it worked out power-wise? The chart below shows our electricity use before and after the change (after first subtracting EV use). (1)

That looks like a remarkable 30% reduction in our electricity use. I am going to keep an eye on it over the coming months, but I don’t see why this wouldn’t hold up. (2) In fact, we are probably using relatively more electricity for lights now in the winter months than in summer because of the shorter days. If this does hold up, it means we are saving almost $40 each month (200 kWh * $0.19 = $38.00). Given that the EV uses less than that each month, the LED lighting will be paying for our transportation, with some left over. (3)
Encouraged by that easy win, I’ve been monitoring daily electricity use over the past month to see if we can save more. Here is what that looked like:

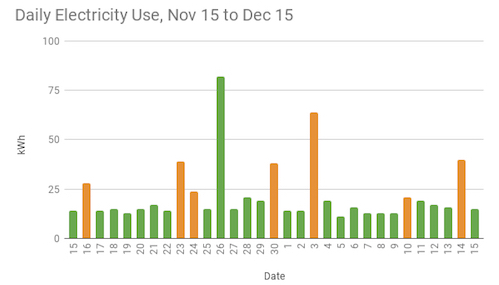
Daily electricity use in our 2100 sf home, with EV charging days shown in orange
There is a baseline daily rate of about 15 kWh that goes up a lot when I charge my EV, and by 2-3 kWh each time I use the clothes dryer or oven for an hour. I have no idea what happened on Thanksgiving, except maybe the oven was on all day. That is a crazy amount of electricity for one day, 82 kWh.
One thing I noticed from this chart is that you can’t tell when I turned on our holiday lights, right after Thanksgiving. (We put them up a little early to brighten up the street during the pandemic.) Adding up the strands and other items, I’d guess we have at most 30 watts, since they are LED. If they run for 8 hours a day, then that is still less than a quarter of one kWh for the day, out of the 15 or so we have baseline. So it’s no surprise they don’t show up.
In contrast, if we were using incandescent bulbs, we would be using much more electricity. Christmas Lights Etc. shows the following comparison for 265 feet of lights:

LED vs incandescent comparison for 265 feet of lights (Source: Christmas Lights Etc.)
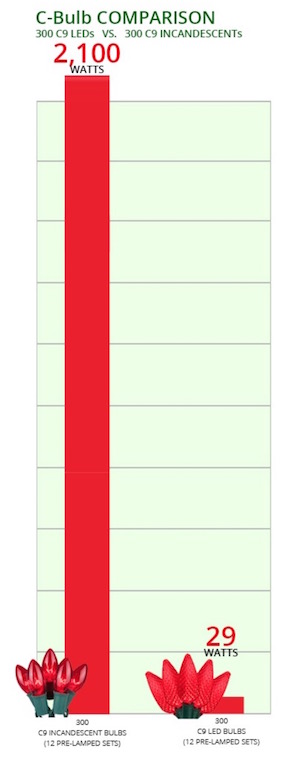
This suggests that LED string lights reduce electricity use by a factor of about 50. The difference depends on which type of light you are using. For mini lights, they estimate that LEDs save by a factor of 6, while for C9s they save by a whopping factor of 70!

LED vs incandescent comparison for 300 C9 lights (Source: Christmas Lights Etc.)
Our lights are mostly C7, so if I assume a factor of, say, 30, then I would be using 900 watts for 8 hours a day, or 7.2 kWh, which would add about 50% to our daily consumption. The LED lights cost more, but since we’ve used ours for several years, they have already paid for themselves in electricity savings. (4) Christmas lights are about to go on sale, so if you want an easy way to reduce your electricity bill, consider getting some LED lights for next year...
Holiday lights aside, I want to understand if I can bump down our baseline rate of 15 kWh a little. Based on data from the City of Palo Alto Utilities, our (new) monthly use of 480 kWh (not including the EV) is only slightly less than the median for single-family homes:

Source: City of Palo Alto Utilities (for fiscal year 2020)
We don’t have a particularly big or busy house, so it makes me think we can do better. I’m going to experiment some to figure out what to try. If it’s fiddly little things, like keeping the printer unplugged, I won’t bother. There are still a number of lights that are not LED -- two sets of vanity lights with yet another kind of bulb, four 300-watt (!) halogen fixtures for which I don’t have a suitable replacement, and some outdoor safety lights. I’ll see what I can figure out. BTW, this might be a fun summer job for some entrepreneurial (and careful) teens, analyzing power use in houses and replacing all the random bulbs with LEDs...
Some of you may be wondering why I’m not talking about gas usage. Stay tuned for that and some other things I tried this year in my next post...
Notes and References
1. Technically, the July bar is mid-June through mid-July, the August bar is mid-July through mid-August, etc.
2. The “December” bar is higher than November because of a very unusual Thanksgiving Day. I’m not sure what happened there, but it’s an anomaly. So usage with LEDs is probably more like 450 kWh/month. I’m not sure why the past few summer months are higher than the 625 kWh I saw on an annual basis, but if it is normally 625 kWh without the LEDs, then the improvement to 450 kWh is still 28%.
3. Lights aren’t “supposed” to save you that much electricity. Usually I read that lights comprise about 15% of a household’s electricity use. But since we don’t have electric heat (only about one-quarter of Californians do), lights are a pretty big part of our electric bill. Switching to LEDs, for us, made an outsized difference.
4. We save over $40 each season. The LED lights cost about $0.05 per day to light up, or $1.50 for a month, compared to incandescent, which would cost about $1.50/day or $45 for a month.
5. If you are curious, Palo Alto Utilities reports that January was the month in fiscal year 2020 with the highest electric use, at 616 kWh on average (783 kWh for single-family homes and 366 kWh for homes in multi-family residences). I don’t know if that is driven by lighting or electric heating or both.
Current Climate Data (November 2020)
Global impacts, US impacts, CO2 metric, Climate dashboard (updated annually)
“There is no vaccine for the planet.” (Inger Andersen, executive director of the U.N. Environment Program, per the Washington Post.) We each have to do our part, and that is especially true for all of us living in high-emission countries. Replacing your holiday lights and the other lights you use most often with LEDs is a great way to start.
Comment Guidelines
I hope that your contributions will be an important part of this blog. To keep the discussion productive, please adhere to these guidelines or your comment may be moderated:
- Avoid disrespectful, disparaging, snide, angry, or ad hominem comments.
- Stay fact-based and refer to reputable sources.
- Stay on topic.
- In general, maintain this as a welcoming space for all readers.


