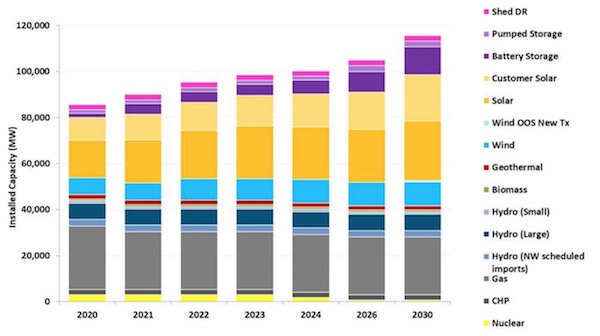
Earlier this year, California’s Public Utilities Commission (CPUC) released planning guidance for utilities. It suggests we add the following resources to our grid in the coming decade (1).
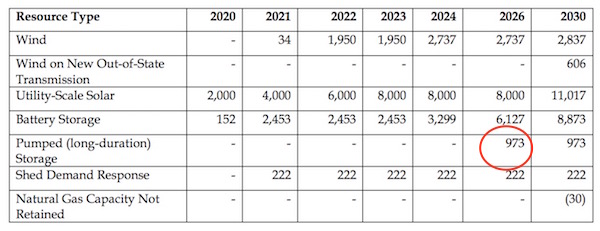
CPUC’s resource buildout guidance, given a 46 million metric ton emissions target (Source: CPUC)
In addition to a big increase in solar power and battery storage plus a modest increase in wind, we see a first-time need for “long-duration storage”. Traditional lithium-ion batteries can provide energy for a few hours, but this type of storage is designed to last for most of a day. In a more aggressive scenario in which we decommission some of our natural gas plants, CPUC suggests even more long-duration storage:
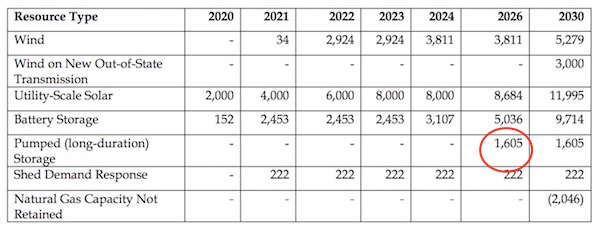
CPUC’s resource buildout guidance, given a 38 million metric ton emissions target (Source: CPUC)
As solar and wind displace gas on our grid, we need to handle extended cloudy or windless periods. The graph below (highlighted in a recent talk by previous Secretary of Energy Steven Chu) shows this general relationship. When a grid has a relatively low penetration of renewables (e.g., less than 40-50%), short-duration storage like batteries suffices to cover gaps in renewable energy. For grids up to about 80% penetration, storage for up to a day’s worth of energy is needed. That is where solutions like pumped hydropower come in. (2)
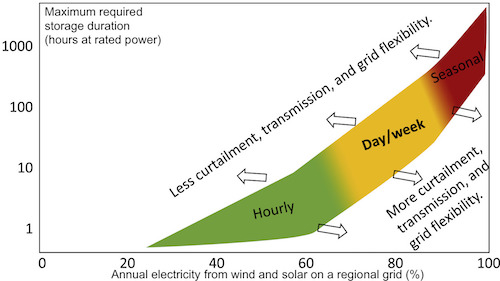
Once a grid is more than 50% or so solar and wind, longer duration storage is needed (Source: Joule)
Pumped storage hydropower (PSH) is a pretty simple technology. When renewable energy is plentiful, water is pumped uphill from a lower reservoir to an upper reservoir. When renewable energy is scarce, water flows downhill, spins a turbine, and generates electricity. The effect is not to create energy. In fact, these facilities are net consumers of energy. But by making renewable energy available when it is most needed, PSH helps renewables better match demand, reducing the need for gas on the grid.
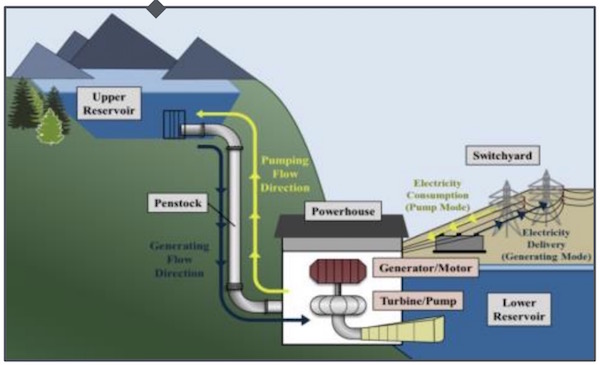
This diagram shows the basic components of a pumped storage hydropower facility (Source: US Dept of Energy). (3)
The greater the height difference between the two reservoirs, and the larger the pipes (aka penstocks), the more power can be produced. The bigger the reservoirs, the more energy can be produced (the longer the power can last). These facilities can be pretty flexible. Newer ones can switch between generating a small amount of power for a long period or a larger amount for a shorter period. And most can switch between pumping and generating energy in minutes, reacting quickly to changes in demand. Moreover, they are pretty efficient, generating about 80% of the energy that they take in. (4)
This isn’t new. Pumped hydropower has been around since the late 1800s, but it took off in the United States in the 1960s and 1970s with the development of large, inflexible coal and nuclear power supplies.
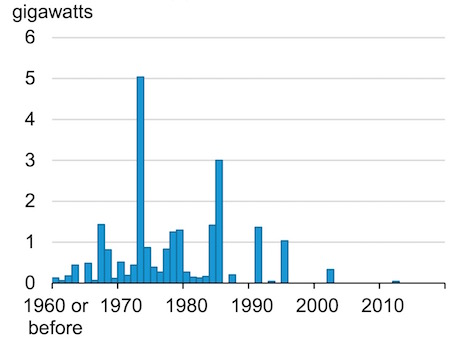
Pumped storage hydropower capacity by initial operating year (Source: EIA)
The flexible hydropower resource was ramped up and down to better meet the demand curve. Today it serves a similar purpose, helping to fill in gaps when our inflexible renewables fall short. You can see how that works in the chart below. This type of flexible hydropower makes up around one-third of Palo Alto’s power supply.
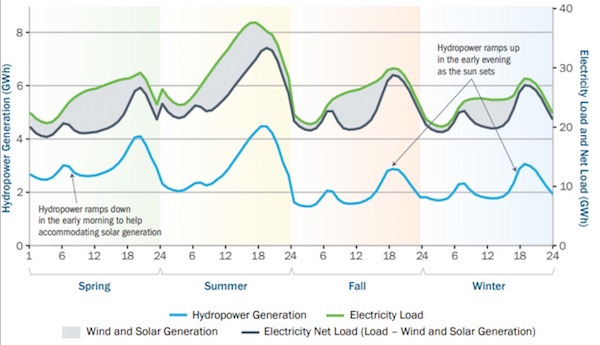
Pumped hydropower on California’s grid ramps up to meet early morning and evening demand, when solar is insufficient (Source: US Dept of Energy)
Today over 95% of electricity storage in the US is in the form of pumped hydropower, but there’s just not that much of it. The 40-odd facilities we have cover only 2% (22GW) of our total power capacity (1 TW). (5) It’s not for lack of trying. The Department of Energy reports that 55 new PSH projects were in the development pipeline at the end of 2018, totalling about 30 GW. (6)
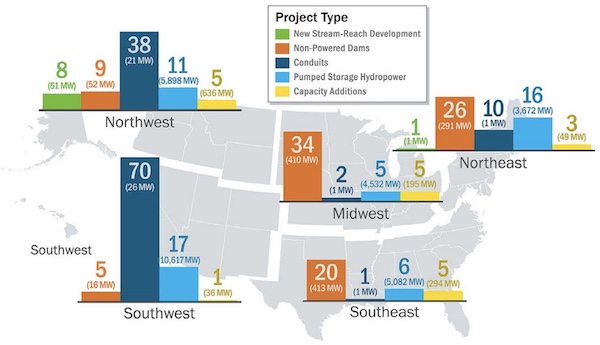
Hydropower projects in the pipeline in the US at the end of 2018, with pumped storage in light blue (Source: US Dept of Energy)
But some of these applications have been lingering. In fact, as you can see in the bar chart above, only one PSH system has been built since 2010. The problem is that big projects in remote areas have long permitting times and large upfront costs. Permitting complications include impacts on free-flowing rivers, harm to fish and wildlife, flooding of scenic areas, additional transmission requirements, and use of increasingly scarce water resources. And although PSH is cheaper than batteries for these long durations (7), the capital costs can be several billion dollars for a large facility. How can we mitigate these problems?
It can simplify things if you are adding a pump to an existing hydropower dam, as is being proposed for the Hoover and Glen Canyon Dams. But even so you need to identify and connect to an upper reservoir. Most developers now are proposing “closed loop” facilities that recycle water between the two reservoirs rather than taking in fresh water from a river. This can reduce environmental impact. You can further reduce costs and impact by developing the reservoirs in existing features like old mines.
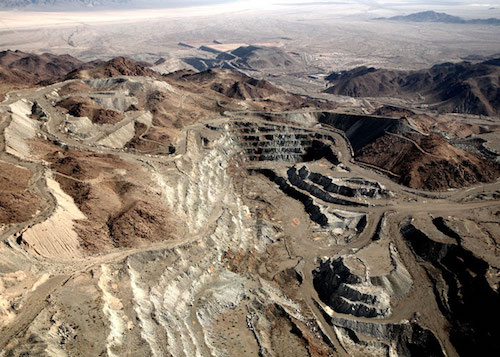
An open pit mine that is one of Eagle Mountain’s two reservoir sites (Source: GEI Consultants)
The proposed 1.3 GW Eagle Mountain project near Joshua Tree National Park in Southern California is proposing closed-loop PSH with each reservoir located in an open pit mine. This has helped with permitting (they have a license to construct), as has its proximity to a major transmission line. But concerns remain about the use of an underground aquifer to fill and replenish the reservoirs, and they are still working on financials.
Another relatively promising project is the 400 MW Gordon Butte project in Montana. It is also a closed-loop facility on private land located near transmission, though it requires construction of two reservoirs.
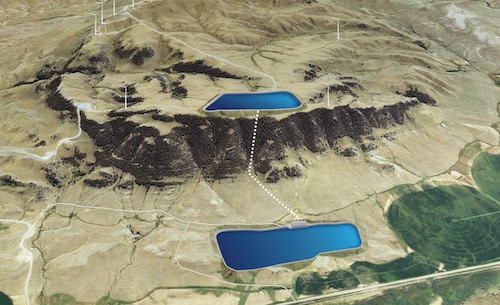
Proposed Gordon Butte reservoir in Montana (Source: Absaroka Energy)
Goldendale in southern Washington is yet another closed-loop proposal on private land, with two man-made reservoirs near ample transmission. The site is an old aluminum smelter, so the proposal includes cleanup of the site as well. It would use water from the Columbia River for the initial fill and replenishment. With an impressive 2400 vertical feet between reservoirs, they are aiming for 1.2 GW of power and hope to be operational by 2028.
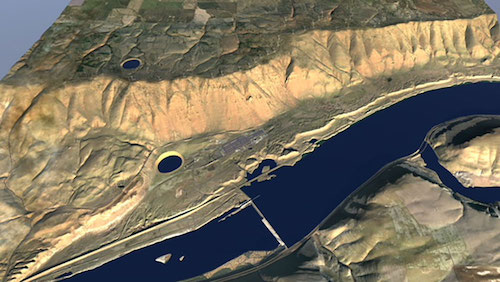
Depiction of the Goldendale project (Source: Rye Development)
A different approach is to use the ocean. Below you can see a small closed-loop system on an island, using the ocean as the lower reservoir.
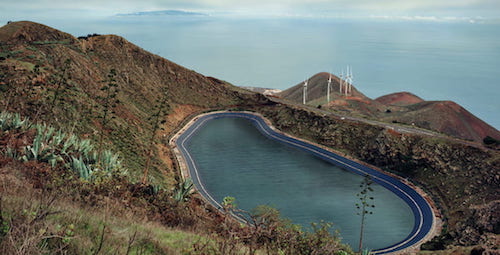
Pumped storage hydropower in the Canary Islands (Source: Idom)
But some projects are more difficult. A plan to build pumped storage at Lake Elsinore in southern California has been on the books since 1997. The lake would serve as the lower reservoir and an upper one would be built nearby. This is a recreational lake in the middle of a small town, with residents concerned about impacts on recreation use and water quality. Furthermore, a new 32-mile transmission line is needed that will route through local forest, and residents are concerned about fire. Lake Elsinore residents and lake users continue to organize in opposition.
Even the best large, custom designs are expensive and slow, so the US Dept of Energy has looked into small modular systems. But it’s not clear that the reduction in overhead would be enough to offset the much smaller size of the projects. Other developers are looking at using tunneling machines to expedite construction and reduce costs. Quidnet Energy is looking to drill into underground rock layers for the lower reservoir.
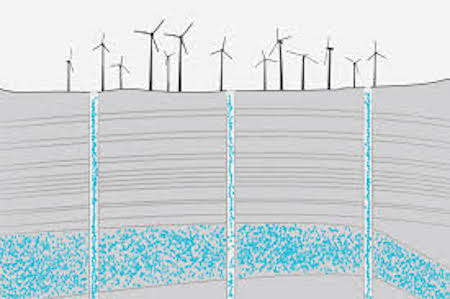
Standard parts and oil and gas expertise can be used to create an underground reservoir (Source: Oil and Gas)
These ideas can save time and cost. Leasing is another possibility to help with large upfront costs that may otherwise deter buyers. The CPUC’s new signal confirms a market, which can reassure buyers. Will one of these projects get over the finish line by 2026? Or will a cheaper or lower-impact option take hold, like compressed air or flow batteries? It will be interesting to see what innovators come up with and whether our government is able to streamline the path from invention to deployment as we accelerate our efforts to clean up our power grid.
Notes and References
0. The City of Palo Alto Utilities has recently started a sustainability e-newsletter for kids. You can find the first two issues with fun educational activities to help your kids learn about environmental sustainability here.
1. The chart below shows how CPUC’s guidance evolves today’s energy mix over the coming decade.
2. With 80% or more renewables, we need to handle multi-day or even multi-week periods without sun or wind, which might involve hydrogen or something new. But what’s reassuring is that we can have a lot of renewables on the grid without zero-emission seasonal storage.
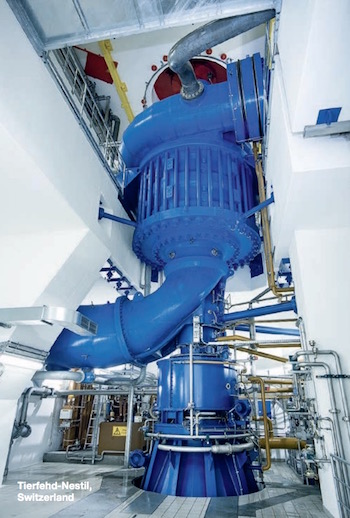
3. Here is a photo of a pumped storage mechanism from hydropower developer Andritz. The reversible pump-turbine is on the bottom and the motor-generator is on top.
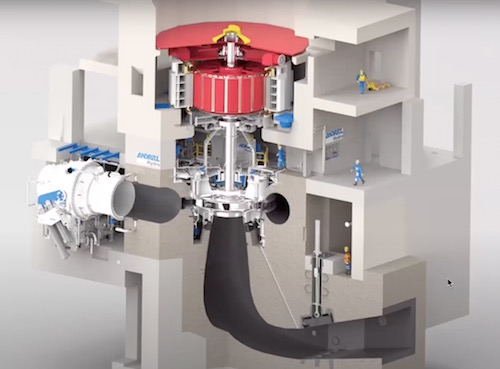
Here is diagram of a recent PSH installation in China, also from hydropower developer Andritz.
4. Plants with larger vertical drops (called “heads”) are more efficient, and may be as high as 85%.
5. This data is from 2017. For comparison, by the end of 2018, we had less than 1GW of battery storage.
6. The LA Times reports FERC applications for 51 GW of pumped storage hydropower.
7. Section 4.3.8 of this lengthy report on storage cost and performance for the US Dept of Energy has a lot of information about the costs associated with PSH and technical innovations.
8. The Global Energy Storage Database inventories energy storage facilities around the world.
9. A team in Australia has identified potential sites for pumped storage hydropower. It’s fun to play around with. They have suggestions for flooding various portions of Wunderlich County Park, Portola Valley, and Pescadero, to name a few....
10. Stanford’s Global Energy Forum hosted a conversation with Steven Chu, Nobel Prize-winning Professor of Physics at Stanford and the twelfth Secretary of Energy. It is jam-packed with information about long-duration storage technology and government programs to encourage it. Chu is also pretty funny -- worth watching!
Current Climate Data (June 2020)
Global impacts, US impacts, CO2 metric, Climate dashboard (updated annually)
The first half of 2020 was the second warmest in the 141-year record, with combined land and ocean surface temperatures at 1.93F above average.
Comment Guidelines
I hope that your contributions will be an important part of this blog. To keep the discussion productive, please adhere to these guidelines or your comment may be moderated:
- Avoid disrespectful, disparaging, snide, angry, or ad hominem comments.
- Stay fact-based and refer to reputable sources.
- Stay on topic.
- In general, maintain this as a welcoming space for all readers.


