In the past, some dissenters have referred to presentations like this one (commissioned for Memphis) that describe how most pedestrian malls have failed. Downtown areas around the country were converted to pedestrian malls in the 70’s, but in many areas pedestrian traffic dropped off, stores closed, and vagrancy grew. One commenter a few years ago went so far as to say “Any time cars are restricted, there is an accumulation of homeless people and vagrants, and it really kills the vitality of the place. A constant flow (of traffic) is really necessary for the health of the street.” That seems implausible to me. More generally, though, the Memphis report has some reflections on which street conversions fail (page 14) and which succeed (page 17). How do our odds shape up? My feeling is we can do pretty well, at least by that analysis.
That said, a successful pedestrian-friendly downtown takes active management and investment. I’m not sure how many of you are familiar with the iterations of Lytton Plaza in downtown Palo Alto, but that was a work in progress for many years. At minimum the pedestrian areas need to be kept clean and welcoming, but some of the nicest “shared streets” have features that involve significant expenses, which we can ill afford right now. Those include removal of curbs and sidewalks, distinctive paving and lighting, benches and plantings, removable bollards, and bike parking. Let’s assume we have none of that. We could use traffic cones to block off the street and deploy some (well-spaced) inexpensive seating (2) and a few bike racks. Takeout and shopping queues would have more room outdoors. It’s a tough balance, because we want to encourage shopping but not gathering. Is this shoestring effort to create more space worth trying? Or by attracting more people to downtown are we too likely to encourage social proximity, which I expect will be problematic throughout the nice weather?
Our downtown streets include University Avenue and California Avenue in Palo Alto, Santa Cruz Avenue in Menlo Park, and Castro Street in Mountain View. Below are a few pictures, but the blocks vary a lot and some may make more sense than others. The pictures give you a sense of the space we dedicate to cars for driving and parking.
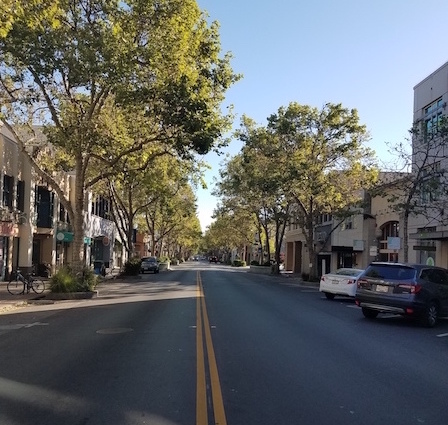
University Avenue in Palo Alto
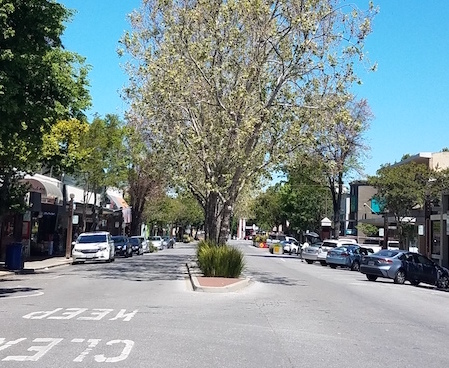
Santa Cruz Avenue in Menlo Park
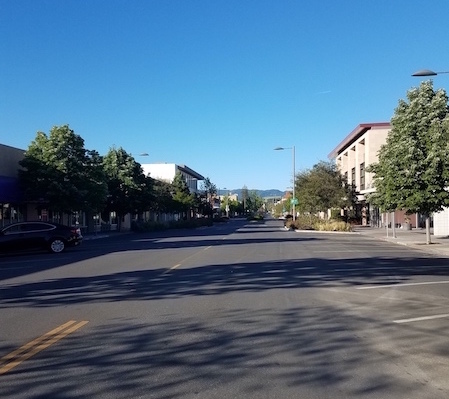
California Avenue in Palo Alto
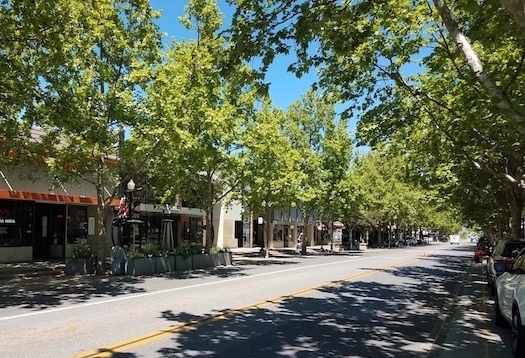
Castro Street in Mountain View
What could it look like instead? There are a number of variations on pedestrian-friendly downtowns, though all create more space for people. “Shared streets” prioritize people but also allow for some vehicles. The traffic can be two-way or one-way. Other plazas may just have a lane for bikes and emergency vehicles. Some allow buses. “Pedestrian malls” are limited to walkers. You can see examples of many of these by looking around in Google Street View at the 3rd Street Promenade in Santa Monica, Pearl Street in Boulder, 16th Street Mall in Denver, Nicollet Mall in Minneapolis, or Fort Street in Auckland. (Feel free to suggest others in the comments.) Here are some snapshots that show a variety of configurations.
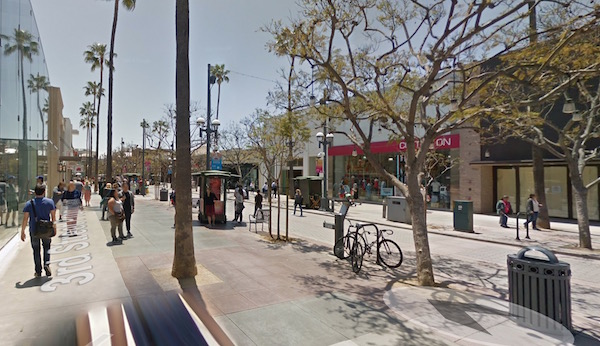
Third Street in Santa Monica (from Google Street View)
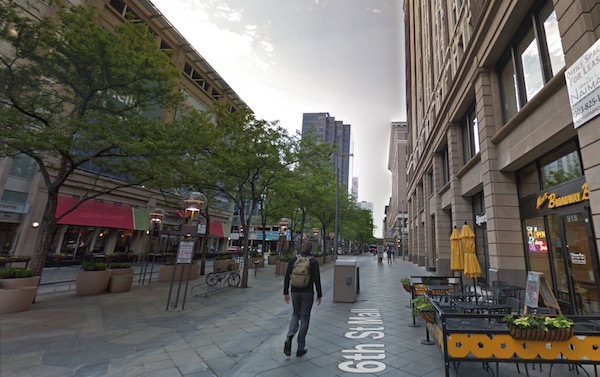
Sixteenth Street in Denver (from Google Street View)
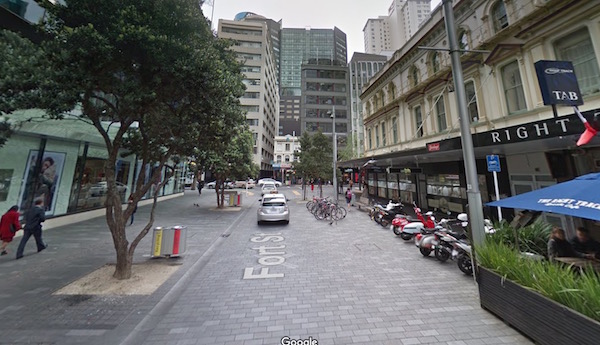
Fort Street in Auckland (from Google Street View)
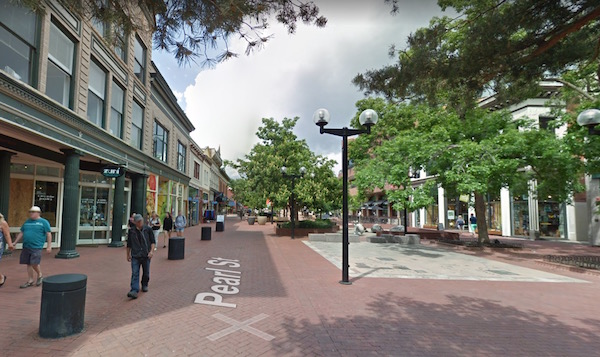
Pearl Street in Boulder (from Google Street View)
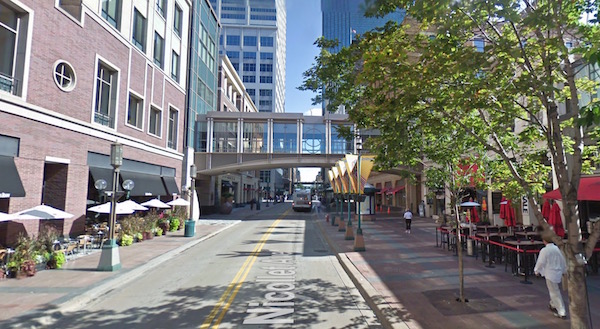
Nicollet Mall in Minneapolis (from Google Street View)
You can see that some allow cars and some don’t, some are one-way, others are two-way. None have car parking. All are more polished than we can do for a trial, and we have various impediments like parking bulb outs and street medians to deal with. But we also have a lot of flexibility. Could we put (well-spaced) dining tables in some bulb outs, seating in others, and reserve the street for buses and bikes? We could limit it to Friday-Sunday or weekends, and just a few blocks. But we face the paradoxical concern that a more spacious and more welcoming downtown might encourage more people to linger. Should we go for more spacious but not more welcoming? Or just keep things as-is?
Notes and References
1. Even in 2007 they were saying “This is an old issue that gets resurrected every four or five years.”
2. I expect we could borrow some seating from closed concert or sporting venues.
3. This page has ten “before and after” pictures from various streets in New York City.
4. As another very new data point, Market Street in San Francisco recently went car-free. The San Francisco Chronicle covered it, and the aftermath. KQED has a writeup with some good references at the end. The larger project page is here.
Current Climate Data (March 2020)
Global impacts, US impacts, CO2 metric, Climate dashboard (updated annually)
Here is a really interesting statistic. Between March 28 and April 26 of this year, electricity use in Europe+UK was down 14% from 2019, but electricity emissions were down a whopping 39%. A small drop in power use led to a much larger drop in emissions. The chart below from Carbon Brief shows why. It’s great to see the leverage that green policies, technologies, and pricing are enabling.
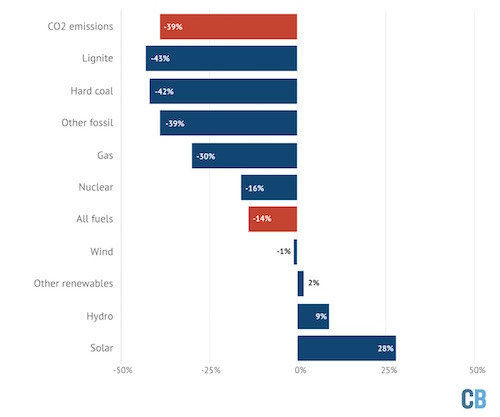
The top bar shows that emissions from power plants in Europe+UK decreased by 39% from 2019 to 2020, when measured from March 28 to April 26. The upper blue bars show that was due to large drops in demand for the most carbon-intensive power sources during that period. Renewables in contrast mostly grew (the lower blue bars), despite power use dropping by 14% in that interval (as shown in the shorter red bar). Source: Carbon Brief
Comment Guidelines
I hope that your contributions will be an important part of this blog. To keep the discussion productive, please adhere to these guidelines, or your comment may be moderated:
- Avoid disrespectful, disparaging, snide, angry, or ad hominem comments.
- Stay fact-based and refer to reputable sources.
- Stay on topic.
- In general, maintain this as a welcoming space for all readers.


