This blog attempts to tackle the question of gas heat vs electric heat. There are two parts to that. The first is, what emissions are produced in order to get gas and electricity delivered to the home? And the second is, for each unit of electric or gas energy, how much heat can it produce? (That is, how efficient is the heater?) There is a lot to this, and I don’t have a perfect answer, but I’ll relay here what I know. This is largely based on a few presentations by Martha Brook, a policy advisor to the California Energy Commission (CEC). (3)
If you want the short summary for homes in our mid-peninsula area, I would say it is:
- A heat pump water heater is a clear win.
- A heat pump space heater is a clear win for new construction and for renovated homes that have minimal heat loss. Other homes should do more insulating first.
The analysis below has some gaps and work on this is on-going.
Gas Emissions vs Electricity Emissions
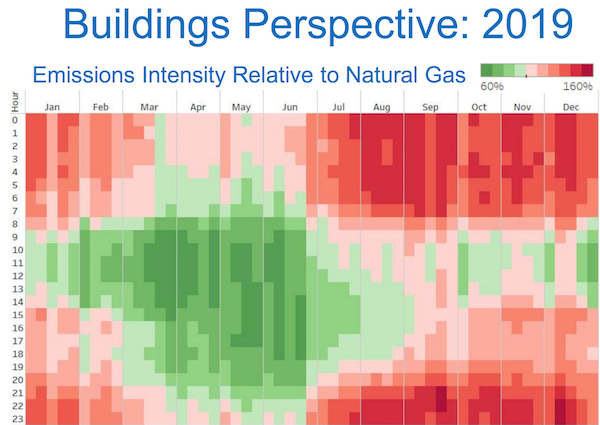
The chart below compares electricity emissions to gas emissions, as delivered to a home. (4) No appliance is using the energy yet; the chart reflects emissions just from generating and delivering the energy to the home. The chart has one square for each hour of the year. Months go across the x-axis (from January on the left to December on the right), and hours go along the y-axis (from early morning at the top to late night at the bottom). A green square indicates that electricity has lower emissions intensity than gas, measured in emissions per unit of energy, while red means electricity has higher emissions. 40% of the squares here are green and 60% are red. On average, gas emissions are lower than electricity emissions. (Yes, you read that right.) And in particular you can see that the comparison is poor for electricity during times when you might be likely to be heating a home (e.g., fall and winter mornings and evenings).
Source: June 2018 presentation at a CEC workshop
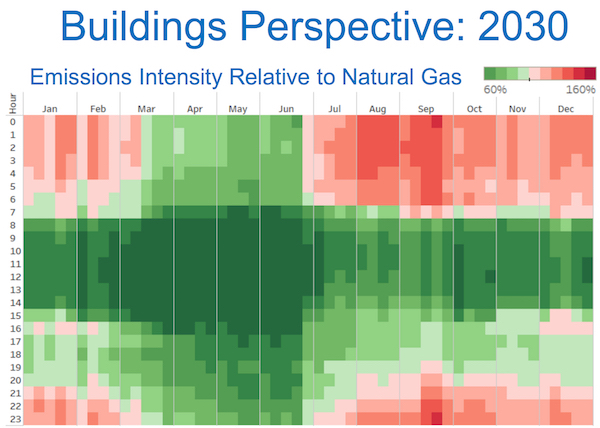
If you look to 2030, when we will have more renewables (60% compared with 31% last year), the picture is better, with 70% of the squares favorable for electricity, though it has a similar overall pattern.
Source: June 2018 presentation at a CEC workshop
It is important to note that fugitive emissions (methane leaks from transmission and distribution) are not included in the calculations behind this diagram, while the corresponding adjustments for electricity (transmission and distribution losses to the home) are included. Methane leaks can be significant (see this earlier blog post), so that is likely to make these pictures greener, at least in the near-term while those leaks are being addressed.
Heater Efficiency
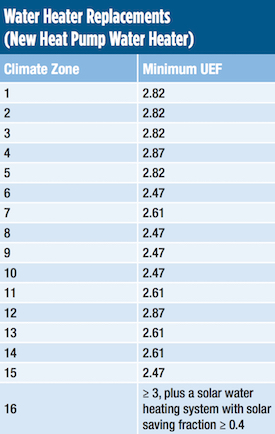
Given the above, we know that heater efficiency is critical if we want to reduce emissions by switching from gas to electric. An electric heater that is “just” 95% efficient, like the best modern gas furnace, is not going to cut it. And that is the magic of heat pumps. A typical heat pump water heater produces about three times as much energy (heat) as it consumes. Instead of creating heat, it extracts heat from the outside air, using a refrigerant, and moves it into the building. This is more or less how a refrigerator operates, but in reverse. (5) A measure called UEF, or Uniform Energy Factor, is used to compare heat pump water heaters. It is a ratio of the energy output to input, but with some nuances. Per a spokesperson at the CEC, the metric is pretty reliable for our area: “UEF includes standby tank losses during the test procedure, as well as measuring the performance of the heat pump over the whole test procedure. In general we find that the UEF gets you in the ballpark of actual performance in mild climates, but for colder climates or larger households there is more backup electric resistance use and therefore the performance would be lower.”
You can see from this chart that replacement electric water heaters are required to have a UEF of nearly 3. Palo Alto and Mountain View are in climate zone 4, while Menlo Park and other San Mateo County cities are in climate zone 3. By contrast, the Tahoe area is climate zone 16.
Source: CEC Title 24 standards
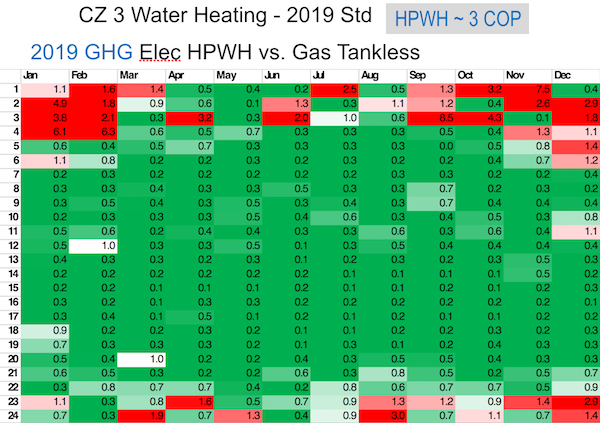
Because of this high efficiency, heat pump water heaters are a clear emissions win. The chart below shows how a heat pump water heater with about 3x efficiency compares with a tankless gas water heater. This is similar to the chart above, but taking into account the water heater as well. (6)
Source: Presentation to Redwood Energy, February 2019
Space heat pumps, however, are not such a clear win. These heat pumps will run nearly constantly in the cool and relatively dirty night hours, while a gas furnace will run infrequently. That means the gas furnace has much lower emissions at nighttime, even in a well-insulated house as shown below. (7)
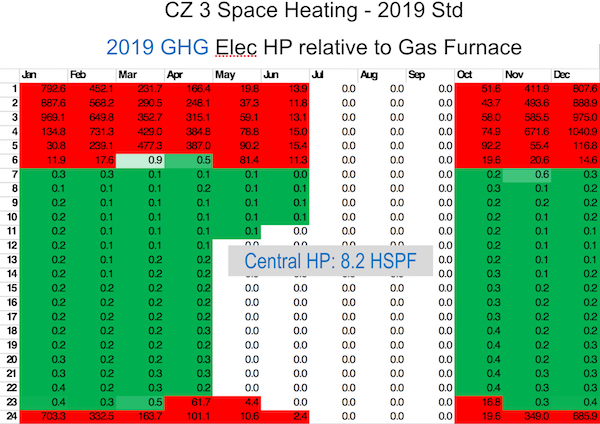
Source: Presentation to Redwood Energy, February 2019
When you look across the whole day, there is still a sizable benefit to using a heat pump for space heating. (Space heaters that exceed the minimum of 8.2 HSPF will do somewhat better than shown here.)
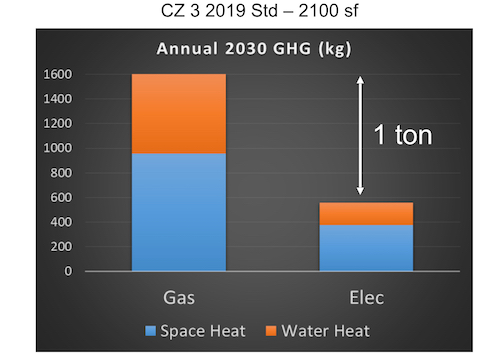
Source: Presentation to Redwood Energy, February 2019
If your house is not well insulated, though, the story is different. If you live in a home with less insulation and thinner windows, a heat pump for space heating will not reduce emissions, even assuming a cleaner 2030 grid, as shown below. Instead, the best thing is to improve insulation first.
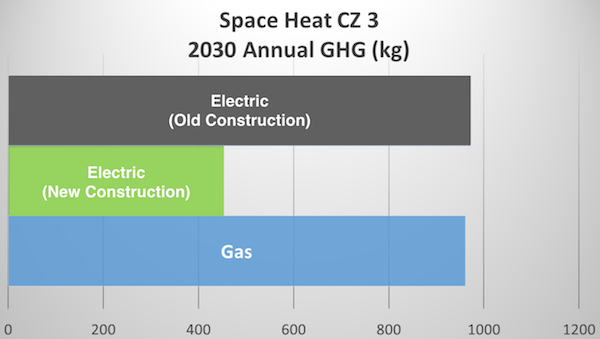
Source: Presentation to Redwood Energy, February 2019
To summarize, if you aim to reduce your heating emissions, a heat pump water heater is a clear win, as is a heat pump for space heating if your home is built to modern codes (i.e., is well insulated). Older homes need a better “building envelope” before switching to an electric heat pump for space heating will reduce emissions. Reducing a home’s heat loss is a good idea not only for reducing emissions but also for better resilience to energy outages.
There are a number of factors besides emissions that come into play when deciding on electric vs gas heat. They include cost, resilience to outages, home impact (e.g., air quality, noise), heater placement, and safety. See the videos linked to in this earlier blog post if you want to see real-life methane leaks from gas water heaters.
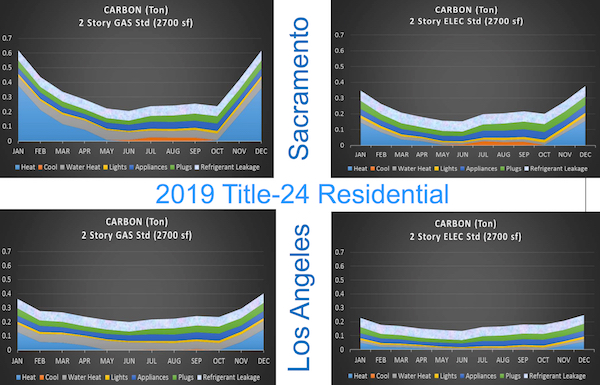
Even when considering only emissions, this post neglects not only the fugitive emissions of gas to the home but also the impact of any leaking refrigerant from the heat pump. (8) So this is not a complete picture. But I hope it provides more information about how heaters are evaluated and what might make sense for your home.
Two of our local utilities are offering significant incentives for heat pump water heaters. Silicon Valley Clean Energy (SVCE) information can be found here: https://www.svcleanenergy.org/water-heating, including a link to an informative buyers guide. Palo Alto Utilities has information here: http://cityofpaloalto.org/hpwh. PCE does not currently have an incentive for heat pump water heaters. (They are running a trial, which is fully enrolled.) However, they do have terrific incentives for EVs. Check it out here: https://www.peninsulacleanenergy.com/about-evs.
If you are interested in learning more about electrifying your home, on Thursday October 10, from 2-7pm, the City of Palo Alto Utilities is hosting the Bay Area Electrification Expo in coordination with local partners to provide hands-on education and resources for building professionals and area residents wanting to further reduce their carbon footprint. Stop by to learn more about the benefits and “how to’s” of electrifying space and water heating, transportation, and cooking.
Thank you to Martha Brook and to representatives from the local utilities for reviewing and giving feedback on this post.
Notes and References
1. This data point comes from slide 4 of this presentation by Martha Brook at the CEC.
2. That is not the case for electricity. Because Palo Alto has so much commercial space, over 80% of our electric load is from commercial use(!)
3. The June 2018 presentation at the CEC (part of a larger workshop) is here, about 26 minutes in. The February 2019 presentation at Redwood Energy is here. All information for the June 2018 CEC workshop can be found here.
4. This chart and others in this post reflect the actual grid mix rather than our portfolio mix, which is much cleaner. If we were to adopt a model where we use a cleaner portion of the grid, then others would have to use a dirtier portion of the grid. And (a) they aren’t doing that, and (b) we don’t want them to do that because (c) it doesn’t match reality. We want electrification to be happening all over the state, regardless of the electric portfolio the various utilities maintain. Our own utilities’ zero-carbon contributions are to the grid as a whole, making it greener for everyone (thank you!). So I make the emission calculations in this post based on the grid mix, just as I hope others are doing in places with a less green electricity portfolio.
I should also note that this chart reflects average emissions and not marginal emissions.
5. Some videos that explain how heat pumps work can be found here and here.
6. This is for climate zone 3 (“CZ 3”) in a home built to the latest code (“2019 Std”), and it uses the 2019 emission intensity numbers shown in the earlier chart (“2019 GHG”). The “COP” or “Coefficient of Performance” of 3 is the ratio of heat energy output to electrical energy input (a somewhat less robust version of UEF).
7. That is true even when using the cleaner power of 2030, as shown below. The heater used in this case meets but does not exceed minimum federal standards, as required for this testing. (“HSPF” or “Heating Seasonal Performance Factor” is a seasonally averaged COP.) A more efficient heater would do better, but note that the red areas will stay red, given the multipliers in those squares.
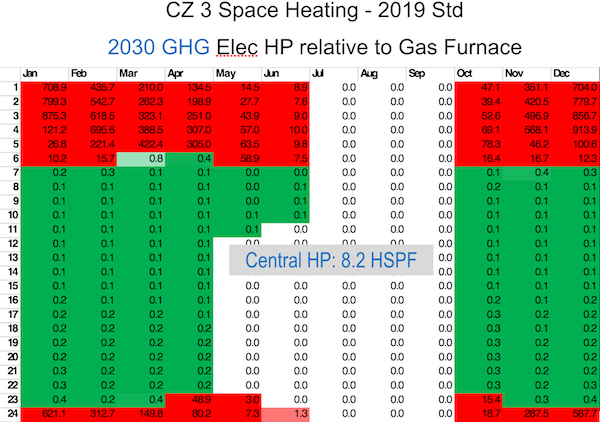
Source: Presentation to Redwood Energy, February 2019
8. This slide (the right-hand side) shows how big an impact leaked refrigerant has on emissions when a home is electrified. The color-coding for these charts is: lightest blue: refrigerant leakage, green: plugs, dark blue: appliances, yellow: lights, tan: water heating, orange: cooling, medium blue: space heating. Our climate is probably somewhere between Sacramento and Los Angeles.
Source: June 2018 presentation at a CEC workshop
9. Some of you may be wondering why we don’t use gas-powered heat pumps. I should follow up on that. One thing to keep in mind is that heat pumps can air-condition as well, and I expect that when they are used for cooling, it makes the case for electric stronger. In addition, for new construction, there are some advantages to omitting the gas line entirely.
Current Climate Data (August 2019)
Global impacts, US impacts, CO2 metric, Climate dashboard (2018)
Comment Guidelines
I hope that your contributions will be an important part of this blog. To keep the discussion productive, please adhere to these guidelines, or your comment may be moderated:
- Avoid disrespectful, disparaging, snide, angry, or ad hominem comments.
- Stay fact-based, and provide references (esp links) as helpful.
- Stay on topic.
- In general, maintain this as a welcoming space for all readers.


