This is the second in a series of posts on using buses to reduce emissions, the first being about inter-city buses.
Effective transit kills two birds with one stone, reducing both emissions and traffic. So I’ve been wondering: If we just had better local transit in our area, would it mean fewer cars as well as lower emissions?
There is no shortage of local transit options.
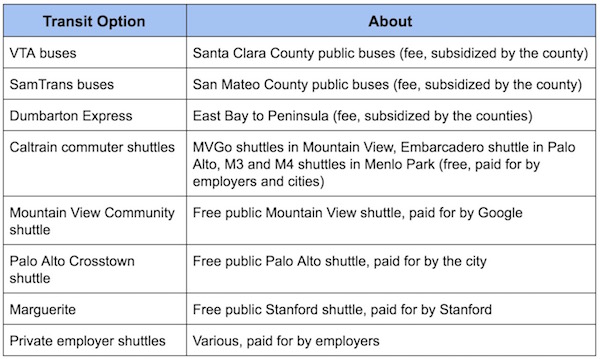
The Transportation chapter of Palo Alto’s Comprehensive Plan has a partial map of these options on pages 5 and 6.
The Caltrain shuttles and employer shuttles seem to work pretty well. I haven’t looked at them much, but there are many of them, they are funded, and the problem they need to solve is fairly straight-forward. (1)
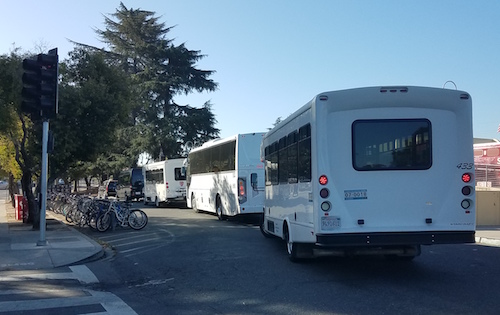
Commuter shuttles waiting one morning at Palo Alto’s downtown Caltrain station
So this post is going to focus on non-commute traffic. (2) Can we reduce those emissions and traffic by improving local transit?
County buses (VTA and SamTrans) on our public transit routes are pretty infrequent (every 30 minutes or so), except on El Camino. Our counties’ transit agencies are investing more on the well-used routes and leaning on our local shuttles to cover the gaps. (3)
In that context, Palo Alto explored how to improve our local transit in a 2017 Transit Vision document, with a lot of focus on improving the city’s shuttle for non-workers. I’ve taken a few rides on Palo Alto’s Crosstown Shuttle and on Mountain View’s Community Shuttle, and I’m not as optimistic as I used to be. It’s not that the shuttles are bad. They are generally fine at what they do. (4) But it’s hard to compete with the flexibility and speed of a bike or a car in our spread-out neighborhoods.
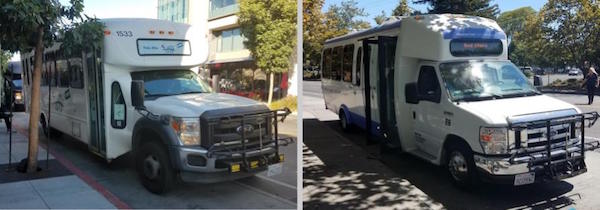
Palo Alto’s Crosstown Shuttle (left) and Mountain View’s Community Shuttle (right)
To begin with, though, I want to highlight a few differences between the Palo Alto and Mountain View shuttles. For background, Palo Alto’s Crosstown Shuttle goes back and forth on a 30-minute north-south route between University and Charleston. Palo Alto fully funds two vehicles, which operate from 7:30am to 5:30pm.
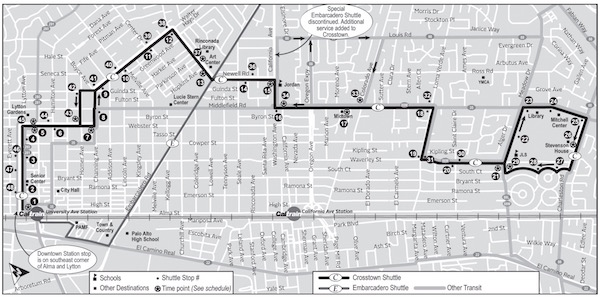
Source: Palo Alto’s Crosstown Shuttle
Mountain View’s Community Shuttle traverses a one-hour loop around the city, with two vehicles in each direction. Google fully funds the four shuttles that operate in Mountain View from 10am to 6pm.
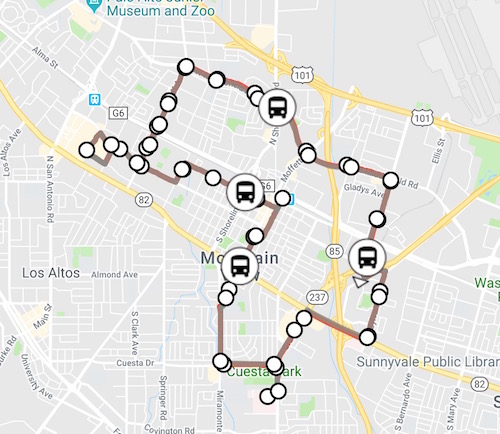
Source: Mountain View’s Community Shuttle Tripshot integration
Both cities’ shuttles visit about 40 stops in each direction every 30 minutes. Palo Alto averaged 276 rides per weekday (Feb 2016), or about 14 boardings per hour per shuttle. Mountain View averages 687 rides per day (2019 to date), or about 21 boardings per hour per shuttle. (5) So that indicates that the Mountain View shuttle is more successful, despite not running during the busy morning hours. What is going on? Here are some observations.
Destinations: Mountain View’s shuttle includes several busy destinations, such as the San Antonio Shopping Center, the Grant Road shopping center and El Camino hospital, and the downtown Caltrain and city center. These are the busiest stops. (6) Many of Palo Alto’s (smaller) analogous destinations (Town and Country shopping, PAMF) are not on the Crosstown Shuttle’s route. Both routes stop at senior centers, senior housing, and middle schools.
Route length: Mountain View’s shuttle covers much more ground, partly because it is a loop rather than an out-and-back. So it can reach more people and places, though at twice the cost.
Rider demographics: I get the sense from my rides, the shuttle stops, and the vision plan that Palo Alto’s shuttle ridership is largely seniors and middle school kids. Mountain View’s 2016 analysis showed that fewer than half the riders are seniors and fewer than 10% are under 18. Mountain View’s shuttle seems to have broader appeal.
Growth: Mountain View’s shuttle ridership has been growing each year since it started in 2015. It grew 24% in 2017, 8% in 2018, and is on track to grow again this year. Several people on the Mountain View shuttle asked the driver about a stop, indicating they were new to the shuttle. The riders on the Palo Alto shuttle, on the other hand, seemed like old hands. Annual ridership on all Palo Alto shuttles has dropped from 181,259 in 2016 to 152,261 in 2017, and to an estimated 140,000 in 2018. (7) Some of the loss in 2017 was due to dropping an East Palo Alto shuttle in 2016. But I also think the lack of investment is showing.
Cost: Palo Alto’s shuttle costs about $3.49 per boarding. (8) That compares favorably with the cost of the average VTA ride, which is $7.97 according to this chart. We don’t know what the Mountain View shuttle costs because Google funds it. While the shuttles look similar, Mountain View’s are electric, and they have only 16 seats instead of 30. So they may be cheaper to operate.
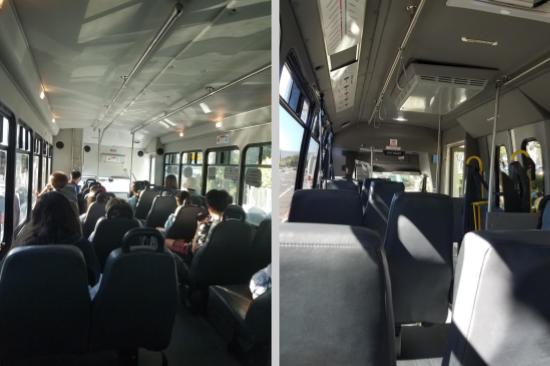
Seating in Palo Alto’s Crosstown Shuttle (left) and Mountain View’s Community Shuttle (right)
Signage: Palo Alto has worked on improving signage, but I still had difficulty recognizing some stops, especially in downtown. (In contrast, the color-zoned parking signs all over downtown are very easy to spot.)
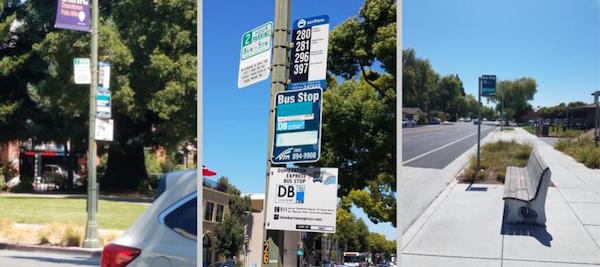
Left: Can you tell if there is a shuttle stop, from across the street? Middle: How about up close, can you tell? (There is!) Right: Even here it is not so easy to see.
Community: A friendly welcome can make a big difference. As an example, many of the school crossing guards are wonderful with the kids, and put a bright spot in their walk or bike commute. The shuttle drivers do not do the same thing consistently. I did notice the Mountain View driver greeting each passenger and enlivening the bus with jazz music. But the Palo Alto driver was quiet and the bus did not have a particularly cheery feel. I think an effort to greet people and make them feel welcome could make a difference.
So, there is room for improvement, some of it inexpensive. That said, I don’t think we should rely too much on these cross-town shuttles if our goal is to reduce emissions and traffic. Palo Alto estimated it would more than triple the cost of the Crosstown shuttle, from $282K to $864K, just to extend it to the Stanford and San Antonio shopping centers. (9) If true, and the cost is not shared with the centers, it seems hard to justify. The Mountain View shuttle ridership suggests we could increase boardings per hour per shuttle by maybe 50%, not by 3x, so costs per boarding would double. Is the incremental reduction in emissions and traffic worth that? (10)
It’s also not clear to me how many cars these shuttles are removing from the roads. Would younger riders be driven or would they bike if there were no shuttle? The distances are pretty short. And even when the shuttles are reducing car traffic, it’s not clear if they mitigate the worst traffic. The Mountain View shuttle doesn’t even start until 10am, missing the busy morning commute. So while they are reducing emissions, I don’t know if they are reducing congestion so much. (In contrast, the commute shuttles are better positioned to help.) Finally, because Palo Alto has lost a good deal of retail and other residential services, many of the places worth going to are outside of the city, but it’s not clear how we fund a multi-city shuttle. As part of my preparation for this blog post, I took transit from Palo Alto to Cheeky Monkey Toys in Menlo Park, switching from the Crosstown shuttle to the SamTrans ECR in downtown. On the plus side, Google Maps was able to plan this route.
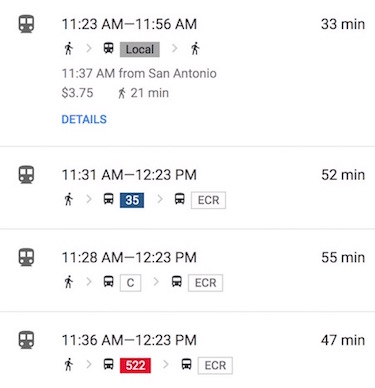
Source: Google Maps mobile app
On the downside, it was a pita, to say the least, and cost $2.25 each way, for which I needed exact change. I am not excited to repeat that odyssey.
I do think the shuttle has a role as senior transit and limited school bus service. That is fairly easy to support at low cost with decent ridership. But given how distributed things are here, a more flexible system seems needed to solve the general problem. So what are some options?
The Transit Vision offers a few in chapter 6 (page 49). The first is subsidizing services like Uber and Lyft. That one surprises me because there is some evidence in cities like San Francisco that they worsen congestion. So I don’t really understand that suggestion. The second option is a flexible shuttle, sort of like Menlo Park’s Shoppers’ Shuttle. However, these can be very expensive. VTA tried a “FLEX On-Demand Transit Pilot” in North San Jose for six months, and a report indicated that it was “an extremely expensive service and not a viable model for reducing service costs. FLEX’s operating cost averaged $200 per passenger over the course of the 6-month pilot with ridership at 0.4 boardings per revenue hour.” Even if that was a particularly bad implementation, those numbers are sobering. A third option is somewhere in between, referred to as “anchored flex”. I don’t really understand it.
I don’t see any estimates in the Transit Vision report for how many cars we can get off the road with each option they suggest. That is an unfortunate gap. But reading between the lines, the report’s authors don’t seem very optimistic about the potential for transit. They view cars as too attractive and easy to use. “While full build-out of a fare-free citywide transit system that serves all residents, employees, and visitors to the greatest extent possible is the ultimate vision, it cannot be fully achieved without complementary policy, behavioral, and built environment changes. For example, a Palo Alto resident with full access to a private vehicle will likely drive to downtown, Town & Country Village, California Avenue, etc. for a shopping or dining trip even with accessible shuttle service because parking is free. For a choice rider, a very low marginal cost of driving begets driving.”
I am not sure I agree that. With all of the traffic these days, cars are no picnic. We have few good options. Short of redesigning our whole city, my reluctant conclusion is that we need to continue to encourage and normalize the use of bikes, ebikes, and other bike variants for local trips. They are fast (enough), flexible, low-cost, higher throughput than cars, and zero emission. Every day I seem to see a new kind of bicycle wheeling past, kids in front, wagon in back, third wheel, etc. It’s a great topic for a future blog post, maybe something to get excited about. But I just can’t excited about local transit in our area making a big dent in non-commute emissions or traffic.
LMK what you think, though. I’d love to be wrong, and there is a lot I don’t know about this topic.
Notes and References
1. You can find a link to the Menlo Park commute shuttles here, to the Mountain View commute shuttles here, and to the Embarcadero Palo Alto commute shuttle here.
2. If you look at Vehicle Miles Travelled (VMT) around the country, two-thirds of it is not work-related.
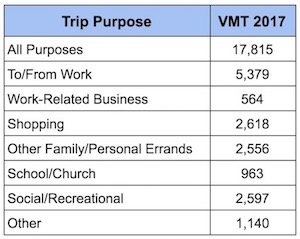
Source: Bureau of Transportation Statistics
3. This map shows VTA’s planned county-wide routes for later in the year. They are doubling down on the more popular routes and cutting service where inadequate ridership can lead to prohibitive costs, up to $40/ride as shown in this article from the Weekly.
4. The shuttles themselves were reasonably comfortable. The Palo Alto shuttle was air conditioned, but had a poor (squeaky and bouncy) suspension. The Mountain View shuttle was not air conditioned (though they are planning to fix that), and it had a high humming noise, which I was told was from the electric engine.
The Mountain View shuttle had easy-to-access real-time information about shuttle location. I could not get Palo Alto’s real-time information to work. Transportation staff told me that when the shuttle operator contract is evaluated this year, they are looking to ensure they have good technology for real-time tracking and getting accurate ridership counts.
5. Ridership data for the Mountain View shuttle is published here. I could not find similar data for Palo Alto’s Crosstown Shuttle, so I am citing just February 2016 data from page 7 of the vision document.
Mountain View also operates the shuttles on weekends from 10-6 at half the frequency (using just one shuttle in each direction). These achieve about 18 boardings per hour per shuttle.
More generally, the table below shows how these numbers compare with other services in the area. The shuttles are not bad. (The VTA 35 route is similar to an extended Crosstown Shuttle.)
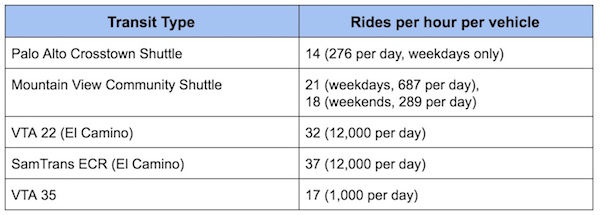
You can see the value of developing density on El Camino, at least as far as transit goes, though it would be helpful to understand which stops are well used, as these are long routes.
6. Data regarding stop usage and demographics for the Mountain View Community Shuttle were shared with me by the staff there. The stop usage data is current, while the demographics are from an earlier survey in 2016.
7. See page 333 of Palo Alto’s 2019 operating budget for these ridership numbers.
8. See page 7 of Palo Alto's Transit Vision for Crosstown Shuttle cost information.
9. See page 45 of Palo Alto's Transit Vision for alternative route costs.
10. Another factor to consider is that Mountain View generally uses more public transit, at least for work, than either Palo Alto or Menlo Park, according to data here, if you click on “Housing and Living”. This same data also indicates that Mountain View has more single-car households. Is that related? Or are the households smaller? It would be interesting to find out.
Current Climate Data (July 2019)
Global impacts (July was the warmest month on record), US impacts, CO2 metric, Climate dashboard (updated annually)
Comment Guidelines
I hope that your contributions will be an important part of this blog. To keep the discussion productive, please adhere to these guidelines, or your comment may be moderated:
- Avoid disrespectful, disparaging, snide, angry, or ad hominem comments.
- Stay fact-based, and provide references (esp links) as helpful.
- Stay on topic.
- In general, maintain this as a welcoming space for all readers.


