Calculate your EV mileage (custom for CA) | A New Shade of Green | Sherry Listgarten | Mountain View Online |

Local Blogs

A New Shade of Green

By Sherry Listgarten

E-mail Sherry Listgarten

About this blog: Climate change, despite its outsized impact on the planet, is still an abstract concept to many of us. That needs to change. My hope is that readers of this blog will develop a better understanding of how our climate is evolving a...  (More)

View all posts from Sherry Listgarten

Calculate your EV mileage (custom for CA)

Uploaded: May 30, 2019
There was an interesting discussion in the comments of a recent blog post, and I thought it would be fun to create a simple EV mileage calculator that uses local data about our power grid as well as the time of day you charge your car. So, here goes, in three simple steps.

Step One: Determine your kWh mileage (e.g., 3.5 miles/kWh).

First, estimate the number of miles you get per kWh. If you already know it, for example from your car’s data, then skip ahead to Step Two.

To get a rough estimate, take a look at this fueleconomy.gov page and find the model of the EV you are interested in. Look for the “kWh/100 miles” rating, which is a number between about 20 and 50.

Their estimate assumes you spend about 55% of your driving in city-like conditions, and about 45% in faster highway-like conditions. You can change that by using the blue “personalize” button at the top of the page. Set the time you spend in “stop and go” (city-like) conditions. The more time you spend at high speeds, the worse (higher) will be your kWh/100 miles number. (1) Other factors can also affect this number, such as how aggressively you drive, how hilly the terrain is, and how warm or cool the air is. Since it is relatively flat and temperate around here, it is okay to ignore those.


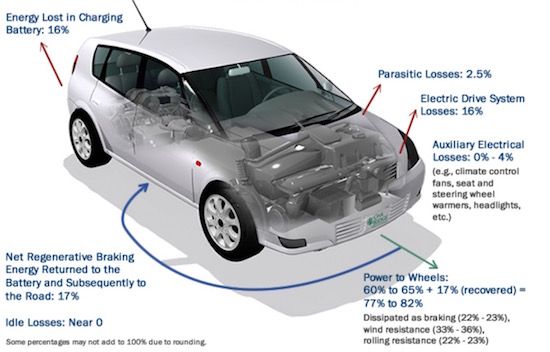
Where does the electric energy go? Interactive version at fueleconomy.gov

Once you have settled on the number, divide 100 by it to get miles per kWh. So 20 (kWh/100 miles) will become 5 (miles per kWh) and 40 will become 2.5.

Here are some examples:
- If you drive the base model 2019 Nissan Leaf, and 55% of your driving is “around town”, then you will be getting about 3.3 miles per kWh.

- If you drive the (much larger) 2019 Audi e-Tron, and 55% of your driving is “around town”, then you will be getting about 2.2 miles per kWh.

- If you drive the 2019 Hyundai Ioniq, and 90% of your driving is “around town”, then you will be getting an impressive 4.3 miles per kWh.

If you are interested, this writeup explains how the EPA derives those mileage estimate. Your mileage may vary :)

Step Two. Determine your charging factor (e.g., 0.5)

As was discussed in the post on the best time to charge your EV, the grid has more gas-generated power on it at certain times of day. As a rough estimate, if you always charge after work and/or at night, use 0.7 as your charging factor (the grid is roughly 70% power from gas). If you always charge midday, use 0.35 as your charging factor (the grid is roughly 35% power from gas). Use something in between if you use a mix of charging times.

Step Three. Do the math.

- Take your kWh mileage (from step 1) and multiply it by 120,429 (BTUs per gallon of gas, source).

- Divide that result by 7809 (BTUs per kWh for our gas-powered plants, source).

This is your miles per gallon if our grid were 100% gas.

- Divide that result by your charging factor (from step 2).

That number is your estimated miles per gallon of gas given the power you are using to charge your EV. (2)

For example, if your kWh mileage is a pretty good 3.7 and your charging factor is 0.4 (you nearly always charge at work during the day), then your estimated miles per gallon of gas is (3.7 * 120,429) / (7809 * 0.4) = 143 miles / gallon.

On the other hand, if your kWh mileage is a lower 3.0 and your charging factor is 0.7 (you charge in evenings and nights), then your estimated miles per gallon of gas is (3.0 * 120,429) / (7809 * 0.7) = 66 miles / gallon.

The EV mileage is better than that of an equivalent gas-powered car for three main reasons: (1) Our grid has a good amount of clean energy on it, which gives the EV “free” miles; (2) The gas is being burned in a relatively efficient power plant, rather than in a relatively inefficient gas engine; and (3) The electric car regenerates power from braking, which a traditional gas-powered car cannot do. (Hybrids also do this.)

It’s interesting to see the wide range of mileage you can get based on the size and weight of your car, where and how you drive it, and when you charge.

Share in the comments if you get any surprises, want to share your mileage, or have improvements to suggest for this mileage calculator. The biggest problem that I see is this calculator only looks at gas-powered electricity, whereas it would be better to look at emissions more generally. The other power sources do have some emissions, which would lower the overall “mileage” of the EV and decrease the impact of the charging time of day. For example, instead of using charging factors of 0.7 and 0.35, respectively, they might instead be more like 0.75 and 0.5. But I don’t have emissions data for each of type of power source, so that is just a guess.

Notes and References

0. This is not meant to be a full lifecycle emissions comparison between EVs and gas-powered cars. That would include additional sources, such as battery manufacture. For those who are interested, there is a recent excellent writeup that goes over some of the complexities in doing the comparison.

1. Electric vehicles get worse mileage at faster speeds, largely due to the loss of regenerative braking. See diagrams for City vs Highway on this page, for example. If you are interested, you can also compare the EV diagram to diagrams for hybrid and gas-powered cars.

2. The EPA provides a miles per gallon equivalent (MPGe) for each electric car, using a conversion factor of 33.7 kWh/gallon. That is based on the ratio of energy in a gallon of gas versus a kWh, and does not account for the inefficiency of power plants in converting gas to electric power. The conversion factor this calculator uses is 15.4 kWh/gallon (120,429 kWh/BTU / 7809 BTUs/gallon), and then on top of that it applies the charging factor, which accounts for the fact that only a fraction of the power on the grid comes from gas.

Current Climate Data (April 2019)

Global impacts, US impacts, CO2 metric, Climate dashboard (updated annually)

Comment Guidelines

I hope that your contributions will be an important part of this blog. To keep the discussion productive, please adhere to these guidelines, or your comment may be moderated:
- Avoid disrespectful, disparaging, snide, angry, or ad hominem comments.
- Stay fact-based, and provide references (esp links) as helpful.
- Stay on topic.
- In general, maintain this as a welcoming space for all readers.

.
Community.
What is it worth to you?

Comments

Posted by Curmudgeon, a resident of Downtown North,
on May 30, 2019 at 7:47 pm

Trouble in Flivver City

My initial reaction to my first exposure to MPGe boasts was something like "What the dickens is that?!" They could only get such a huge number if they tossed all known thermodynamics in the dumpster. A quick calculation confirmed it. Like, 135 MPGe X 0.2 tank to wheel efficiency = 27 MPG-dte (MPG down to earth). Realistic. Respectable. Why not quote it?

So my subsequent reaction has been loathing. Why is the EPA, of all entities, doing snake oil? Their ruse pushes the right kind of cars, but they ought to--must--do it honestly.

Basic fact: EVs don't use gallons of gas or gallons of anything, so MPGe is a-priori meaningless. What matters is distance achieved per energy input, voila, miles/kWh. Or if you prefer gallons per mile: kWh/mile or kWh/100 miles. Per your link the EPA measures that properly. Then, per your link, it conjures up the thoroughly bogus MPGe using a perfectly flawed process.

What we need is a number that shows grams of CO2 released per mile, accounting for the kWh fed through the charger cable each hour, and weighted per the time of day. Same number, properly constructed, for gas or diesel or CNG or H2 vehicles.


Posted by Sherry Listgarten, a Mountain View Online blogger,
on May 30, 2019 at 9:03 pm

Sherry Listgarten is a registered user.

That is not hard to approximate, but with the numbers that I have, it works out even cleaner for EVs, which surprises me because this calculator assumes all non-gas power is emissions-free.

It’s generally understood that burning a gallon of gas releases around 20 pounds of CO2. If you include leakage from production and distribution, it is more than that, maybe 25 (see here). But I am omitting that for now because I’m not sure what the power emissions data covers.

The average power emissions rates shown in the graph at the bottom of this blog post indicate an annual rate of about 425 pounds CO2 per mWh in day and 650 pounds CO2 per mWh at night. I do not know if that includes production and distribution of the natural gas, but assume not for now. (And either way I am only including operational emissions.)

So let’s take the two examples at the bottom of this blog post.

If an EV gets a pretty good 3.7 miles/kWh and charges mostly during the day, then it would emit 0.45 / 3.7 = 0.12 pounds CO2 per mile. That is equivalent to 167 mpg (20 / .12). My calculator had estimated 143.

If an EV gets a lower 3.0 miles/kWh and always charges at night, then it would emit 0.65 / 3.0 = 0.22 pounds CO2 per mile. That is equivalent to 91 mpg (20 / .22). My calculator had estimated 66.

WDYT, besides better understanding what is included in the emissions rates data?


Posted by Staying Young Through Kids, a resident of Old Palo Alto,
on May 31, 2019 at 12:19 am

Staying Young Through Kids is a registered user.

What if my solar (and powerwall batteries) cover my full household electric needs and I dump power back to the PA grid even after charging my Tesla and Leaf? We used to have a Volt, but found the gas would nearly go bad before it was used. Is the combination of renewable solar, home battery storage, and electric cars a responsible or irresponsible family set-up when analyzed from an environmental or even simple economic standpoint? I feel good about what we're doing, but that's not what matters.

The environmental impact of producing these cars, the batteries, and the solar apparatus is NOT insignificant. In fact, a well made & maintained ICE automobile could outlast all of the electric and automotive technology I currently have employed. Assuming we'll be driving (not walking or biking) for most of our trips, what's better for the environment? What's the BEST way to get around the area (with a family & kids) as far as home economy and environmental impact. Yes...we have sports, music, church, school, family, friends, playdates, shopping, etc!!! Bikes, Walking, trains, and Uber don't really work for us before 7am and after 6pm in our neighborhood.

I look forward to an analysis that takes into account home solar arrays w/ batteries that operate with a surplus to the city grid!!


Posted by Tom, a resident of Menlo Park,
on May 31, 2019 at 12:49 pm

Thanks Sherry for again bringing these interesting matters to light.
There are several layers or dimensions to wade through in looking at these matters.
First, the dimensions of Energy or Emissions as Curmudgeon pointed out....
Energy (measured in kWh, Btu, gallons of gasoline ~120,000 Btu combustable at the pump coming from say 160,000 Btu combustable at the well, or therms of frack gas ~ 100,000 Btu combustable at the power plant or say 110,000 Btu liberated from the gas field, (some leaked, some collected, some combusted in processing and transport, some more leaked in transport and storage) or emissions of CO2e ( kg CO2 equivalent where 1 kg of CH4 interferes with global heat shedding equivalent to 86 kg of CO2, which has the mole-wt equivalence of 1 molecule of leaked methane being about 30 times as heat trapping as one molecule of CO2.)
Second, the layers of where to look: 1) at the tailpipe, 2) at the wholesale converter of energy to make car-friendly energy (power plant and refinery), 3) at the oil well and gas well.
Third, choose the applicable type of metric for the decision at hand, such as: a) average emissions regardless of time or policy, b) Instant operational emissions dependent on time but regardless of policy, c) policy based emissions resulting from decision to get a certain type of drive train (electric or gas) recognizing the impact of dropping a gasoline car and adding an EV to a utility who has a policy to procure an annual volume of electricity equal to the new EV's annual needs from sources that match its policy. (e.g.in Palo Alto carbon free sources (new renewables).) d) policy and time dependent (combines b and c.
For brevity, I'll leave this as: Utility Policy influences my device procurement (e.g. electrification decisions to get an EV and a Heat Pump Water Heater etc to have my community get less dirty fossil energy and more clean electric energy.) and as a second order effect... the Duck Curve influences my decisions to be a "Good Gridizen" and maximize the draw on the grid in the times of abundant renewable energy (brunch through siesta hours, especially Sundays) and decrease my draw in times of low renewable generation (dinner hours every evening).
Good policies like we already have on the peninsula combined with electrification (getting EVs and HPWHs) result in more renewables and less fossil fuel emissions. Good behaviors (daytime charging etc) help reduce the fairly small renewable curtailment and help keep down electric costs and help ease the work of fossil duck head power plants.


Posted by Curmudgeon, a resident of Downtown North,
on May 31, 2019 at 9:52 pm

The most direct metric to compare emissions of electric and gas cars would seem to be the mass of CO2 emitted per mile traveled.

For a gas car this is (CO2/gallon gas) / MPG [= CO2/mile].

For an EV it is (CO2/kWh) X (kWh/km) * 1.609 [= CO2/mile]. The (CO2/kWh) factor is set by grid conditions and will vary according to the supply mix, hence time of day.

The first comparison statistic is the direct quotient of the gas car emissions number to the electric car number. The larger it is the relatively more cleaner the EV is.

The second statistic is the MPG of the gas car which would have the same per-mile emission as the EV. To get it, set the CO2 emissions formulas equal to one another and solve for the MPG. Call it MPGeq. We get MPGeq = (CO2/gallon gas) / ( 1.609 * (CO2/kWh) X (kWh/km) ). Again, the bigger the number, the cleaner the EV.

CAUTION: Be sure to use the same units for the CO2 values when applying these formulas.


Posted by eileen , a resident of another community,
on Jun 1, 2019 at 12:09 pm

Yikes, I posted a lengthy comment last night and it didn't get posted. TO sum up, I calculated my MPGe for my little Chevy Spark. Using the most recent 24Kw-hr/100 miles Chevy reported, I got 143 MPGe which seemed awfully high. Recalculating using a 6 month average of 20.33Kw-hr/100 miles, I got 183 MPGe. Something is amiss. Maybe my type of driving doesn't meet the standard for the constants used in the formula. No, I don't spend all my time stopped. Chevy gives me lower calculated MPGe, but still awfully high.
Also, can someone calculate the MPGe for a Tesla? How much difference does the size of the car make?


Posted by Sherry Listgarten, a Mountain View Online blogger,
on Jun 1, 2019 at 5:47 pm

Sherry Listgarten is a registered user.

Great comments, thank you! Sorry for the delayed response, busy with end-of-school-year things. Congratulations to all the happy graduates! May you all go forth and work on climate science :)

@Staying Young. I think the combination of solar + (right-sized) battery + EV is great! It is a big win in terms of emissions, and adds some resilience to power outages. From what I understand, though, it doesn’t (yet) make economic sense. I haven’t done the analysis myself, but that is what I keep hearing. I would expect installation costs to be high in this area as well, because construction costs are so high. I think the poor man’s version is an EV + smart charger + inverter (for outages), which provides at least some of the benefits. I’m not sure solar makes much sense without a battery any more, unless you have big midday loads (like EV charging).

You are right, lifecycle emissions matter, especially the batteries. I believe that looking for batteries that (a) are made in low-emissions places and (b) have an effective recycling program helps. This writeup has some information about that, and end-to-end car comparisons. It doesn’t include a “home power station” (solar + battery), though. My sense is that home power stations are not as efficient as bigger centralized power stations, even though they save some on transmission. I found this blog post on rooftop solar to be pretty interesting in that regard. But given our grid has so much gas on it so often, the home power stations are much cleaner, so I think they are still an emissions win. And they add resilience. So for people who can afford it, I think it’s great, but I haven’t done the analysis yet you are asking for!

@Tom. There are many sources of emissions, which are accounted for by this calculator. I’m not sure if you are just relating that or if there is a particular source you think is missing. Many of the emissions sources you mention are shared by both the gas portion of our electric system and our gas system. My take is the calculator is generally an upper bound on relative EV “mileage”, since the biggest gap is it assumes our non-gas power sources are emissions-free. There are some small differences in the other direction -- producing and delivering natural gas to a power plant may have fewer emissions than producing and delivering gasoline to a gas station -- but I am guessing that is a smaller difference than assuming all non-gas sources are emissions-free. I think at least we both agree that the MPGe calculated by the EPA doesn’t make much sense, since it assumes a free conversion from gas to electric power, as well as a 100% gas grid.

Most likely what you are saying is that none of this matters much, we should just keep buying EVs and heat pumps and, if we can, charging midday. FWIW, I think what is interesting about this analysis is it shows that the EV mileage estimates differ a lot -- a big EV is not that great a car -- and also that charging time makes a big impact, up to 50%. So buying a moderate-sized EV and charging midday can have emissions up to three times(!) lower than buying a large EV that you drive fast and charge in the evening. People might be interested to know that driving one EV can be the equivalent of driving two or three other ones. Well, I was surprised anyway that the difference could be so big.

@Curmudgeon. Yes, I compare the weight of carbon emissions in the comment above, though I avoid the “kilometer” detour, since our data is available in miles anyway.

@eileen. Your estimates could be right, and (using this calculator) 143 isn’t that high, though 180+ is pretty high. The EPA estimate for the Spark is about 26 kWh per 100 miles. Your estimate of 20 is quite low, but probably not impossible. The EPA estimate for a Tesla ranges from 26 kWh per 100 miles to 38 kWh per 100 miles, depending on what kind it is. You can do your own search here.


Posted by Midtown Mom, a resident of Midtown,
on Jun 3, 2019 at 5:30 pm

The official EPA estimates seem low. My BMW i3 gets around 4.9 M/KWH commuting up and down the peninsula but the EPA estimate for my model year is more like 3.5 M/KWH.


Posted by Sherry Listgarten, a Mountain View Online blogger,
on Jun 3, 2019 at 6:43 pm

Sherry Listgarten is a registered user.

Midtown Mom, thanks, good to know! I'd love to know what people find. The way they describe the EPA test is that the "city" driving is stop and start, while the highway driving is consistent higher speed. So i would guess if you are driving at lower speeds without a lot of stop and start, you could do much better. FWIW, I get about what the EPA says for both our gas car and the electric car. I get around 3.8 miles/kWh around town, and around 3.3 on the highway.


Posted by Midtown Mom, a resident of Midtown,
on Jun 4, 2019 at 5:00 pm

The California climate helps. If you were averaging mileage over cold winters the efficiency would go down. And slow traffic on 101 also helps efficiency by, as you say, forcing slower speeds but usually not coming to a complete halt.


Posted by CrescentParkAnon., a resident of Crescent Park,
on Jun 5, 2019 at 1:02 pm

I know the price of gasoline fluctuates a lot, but it always makes more sense to me to calculate dollars/pennies per mile. It just seems more practical though one does have to take the range of gas prices into account.

It's easy in a gas car too. Just reset your trip-odometer every time you get gas and divide the cost of your next fill-up by the miles driven.

The amazing thing about gas is that it takes maybe 5 minutes to load 300-500 miles into your car, whereas an electric if it is completely discharged can take days to re-charge on a regular household outlet, less if you have the special charging rig ... but still a very long time.


Posted by Alan, a resident of Menlo Park: Belle Haven,
on Jun 5, 2019 at 1:40 pm

@Midtown Mom - The difference may be where they measure the kilowatt-hours; whether it's kilowatt-hours taken from the grid, or when it's retrieved from the car's battery. The EPA is going to measure energy as it's pulled from the grid; your car will probably measures it as it comes from the battery. As the power passes through the EVSE, charges the battery, and gets pulled from the battery, there will be some losses. 4.9 miles per kilowatt-hour is 0.222 kilowatt-hours per mile; 3.5 miles per kilowatt hour is 0.286 kilowatt-hours per mile. So, 0.286 kilowatt-hours that get pulled from the grid, sent through an EVSE, stored in a battery, and retrieved from a batter may come out 0.222 kilowatt hours - a loss of 0.064 kilowatt-hours, or 22.4% (0.064/0.286) to heat. Your losses may actually be less than that - you may do better than 3.5 miles per kilowatt-hour pulled from the grid, but these sorts of differences may explain the discrepancy.


Posted by Sherry Listgarten, a Mountain View Online blogger,
on Jun 5, 2019 at 4:06 pm

Sherry Listgarten is a registered user.

@Midtown -- Yes! There are a lot of factors. For me the biggest one is driving at (empty) highway speed. Which is too bad, because I could really use the range when I'm driving fast/far.

@Crescent -- Yes, charging time is not great. For me, I find that in practice, it never matters except for long trips, when it matters a lot. Even with a fast charger, my car (Bolt) gets around 100 miles in 30 minutes, but only if the battery is empty-ish. I can't top it off at that rate. So for a really long drive that means you are stopping for 30 minutes every hundred miles, which is pretty much a non-starter. I think that is the big advantage of hydrogen for cars. With electric, you pretty much have to rent a gas-car if you are driving far. Or try a bus.

@Alan -- Great point, and data! In the EV diagram above, is that what the 16% "Energy lost in charging battery" refers to? (The interactive version describes it as "When charging the battery, energy is lost in converting alternating current (AC) from the electrical grid to direct current (DC) for use in the battery, as well as in overcoming the battery's resistance to charging, which increases as the battery reaches its capacity.") I was wondering why my charger estimate was so different from my car estimate, even accounting for the rare outside-garage charging...


Posted by CrescentParkAnon., a resident of Crescent Park,
on Jun 5, 2019 at 7:13 pm

Sherry, here is what I was able to find online:

Super Fast: This charging option is for public stations only. It gives you around 90 miles of range in about 30 minutes of charge. It requires an available DC Fast Charge port and is only available at locations with such a port. DC Fast Chargers are available at an extra cost for Bolt owners and is useful if you're out and need to fully charge your battery. This electric car charger replenishes up to 160 miles in about an hour.

This seems to say that your super-fast charge is only available in public stations. Do you have one specially installed, and if so how much extra does it cost.

It's too bad that the charging rate is so slow ... BUT, even this was almost unthinkable just a few years ago.

I like the hybrid design but I guess the extra weight of the engine and gas tank decrease the efficiency of the EV?


Posted by Sherry Listgarten, a Mountain View Online blogger,
on Jun 6, 2019 at 1:15 pm

Sherry Listgarten is a registered user.

@Crescent -- Yes, that's right. The fast chargers are not an option for residences. They take far too much power, something the local distribution lines (not to mention the electric panel) are not set up to support. They are generally placed along major thoroughfares for long-distance travel. For all other kinds of travel, a level 2 charger is ample for a large battery. (And even those come sized for different charging rates.)

It's interesting to compare this EV diagram with this hybrid diagram to see the difference in efficiency. Hybrids have 21-40% of their energy going to forward motion, while EVs have 72-94%. EVs are also much simpler and require less maintenance. Plug-in hybrids (like the now discontinued Volt) are more efficient than hybrids, but because they have small batteries and the backup gas engine, they will get worse mileage and still have the added complexity. But I think they are an option for people that take many long trips and for whom renting or borrowing a gas car for those trips is impractical. I'd love to hear if people have come up with other ideas. FWIW, in our house, we drive our EV 95% of the time, but held onto our gas car for driving in snow (it is a 4WD) and to Tahoe in winter. We could just as well have rented if we didn't already have the car or space for it, though.


Follow this blogger.
Sign up to be notified of new posts by this blogger.

Email:

SUBMIT

Post a comment

On Wednesday, we'll be launching a new website. To prepare and make sure all our content is available on the new platform, commenting on stories and in TownSquare has been disabled. When the new site is online, past comments will be available to be seen and we'll reinstate the ability to comment. We appreciate your patience while we make this transition..

Stay informed.

Get the day's top headlines from Mountain View Online sent to your inbox in the Express newsletter.