I was talking with my mom the other day about electric cars. Since I’d just written a blog post on our power grid, I reminded her not to charge her EV in the evening, since there is a steep ramp in demand then that’s difficult for the utilities to accommodate. She replied that she’s fine with that, she always charges hers in the middle of the night anyway when demand is lowest.
That got me thinking -- is that really the best time? Demand is probably low, but is there much renewable power in the middle of the night? When is our electricity the cleanest? When does it get windy, anyway? (It strikes me as funny how discussions about electricity these days often devolve into discussions about the weather. If you look at the CEC's annual report on electricity generation, it basically starts off with a weather report!)
So, let’s talk weather. Which season has the most renewable power? If you think about solar, you’d guess spring and summer have the most, and fall and winter the least. Hydro is also highest in spring and (early) summer, though only “small hydro” counts as renewable, and there’s not much of it. What about wind? Is that also imbalanced, with spring and summer yielding the lion’s share of renewables?
This chart shows monthly metered renewable supply on our grid for each month over the past few years. (1)
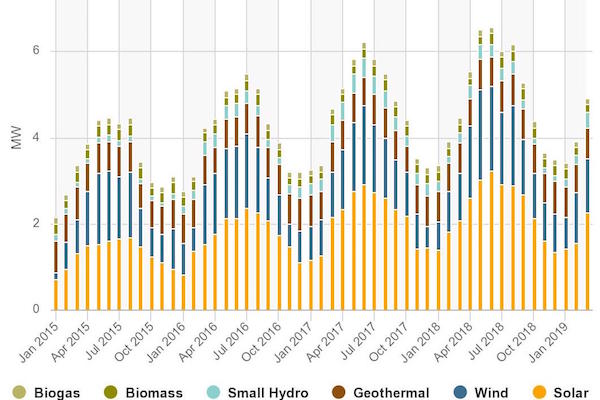
From the March 2019 monthly renewables report found at CAISO
You can see a pretty clear seasonal imbalance in this wave-like graph. We’ve got a lot more renewable energy in the spring and summer (the wave “tops”), including almost twice the solar and wind energy. (2) Large hydropower isn’t shown here (it’s not considered renewable), but you would also expect it to be highest in spring and early summer, making our carbon-free supply even more variable over the year. Only geothermal, biogas, biomass, and nuclear are carbon-free sources that are independent of seasons.
You can also see that our renewable capacity is growing over time, largely from solar. It looks like it’s gone up about 50% just in the last three years. That is pretty great!
So at this point we know we’ve got a big seasonal variation when it comes to renewable power. Seems like it’s better to charge our EVs in spring than in fall. What do variations look like during the day? When does the wind pick up?
Here are some pictures of our renewable power during a day in the middle of each season, spring through winter. (3) The x-axis shows the hour of the day, and the y-axis is measured in megawatts. These are taken from the Daily Renewable Watch reports at CAISO.
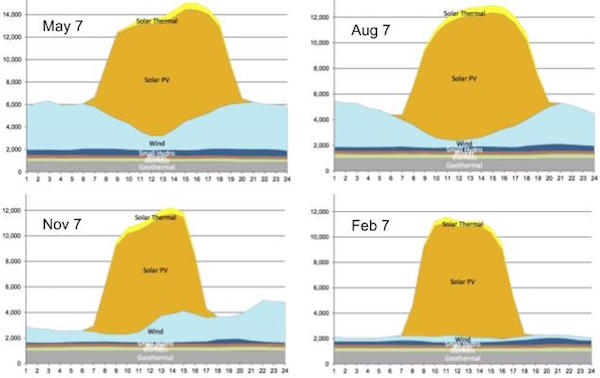
You can see that the sun shines in the middle of the day. Reassuring, that! It doesn’t shine for as long in fall and winter, and it’s a bit weaker, but still it looks like a good amount of power. And more good news, our wind power seems to counterbalance the sun somewhat -- it’s stronger when the sun is lower, at least in spring and summer. But winter looks like a problem, unless demand is really low on winter nights. There is no wind! And does the wind provide enough power even in spring and summer? It looks like we get up to 6 gigawatts of renewable power on a spring night. Is that enough? Does it meet demand?
Take a look at the demand curves below, also from CAISO. The x-axis shows the hour of the day, and the y-axis (too small to see) shows demand measured in megawatts. (The y-axes unfortunately have different scales, so use the annotations on the graphs themselves.)
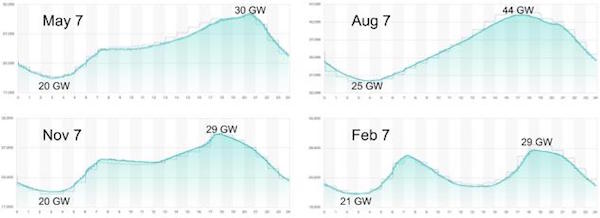
What do you notice? It looks like there is variation in demand throughout the day, and also across seasons. Demand is generally highest in the evening, peaking around 6pm, but there’s also a morning bump (except in summer). Demand is much higher in summer, and lower midday in winter. The good news? We have more renewables when we need them, in summer, and demand is lower in winter when we have less renewable power. The bad news? The numbers don’t look so good. We said we had at best 6 gigawatts of wind power at night, and here we can see we need around 20. Do our other emission-free resources (large hydropower and nuclear) make up for it? Is my mom’s EV getting carbon-free power at night? If not, is there a better time to charge it?
In the graphs below, you can see what kind of power is actually on the grid throughout the day and night, again using those same four days to represent the seasons. Light green represents all the renewables, light blue is large hydropower, and that steady grey line around 2 gigawatts is nuclear. Those are your carbon-free power sources. The orange lines represent natural gas, with the darker orange coming from out of state. I’m including large versions of these, so you can see them more easily. When is our electricity the cleanest? Nights don’t look so good, do they? If you are charging at 2am, then much of the year you are basically filling up your EV with 70% natural gas. Yikes.
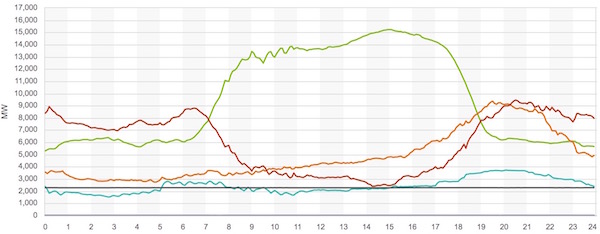
Power Supply on May 7, 2018
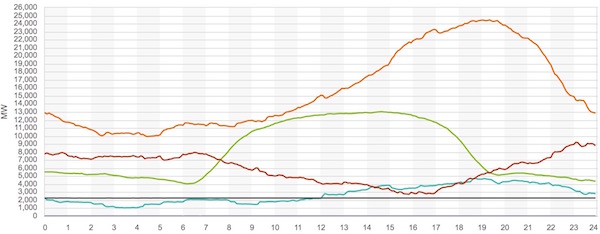
Power Supply on August 7, 2018
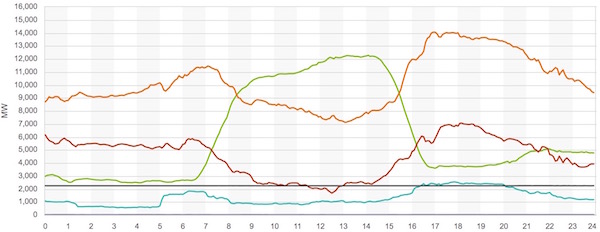
Power Supply on November 7, 2018
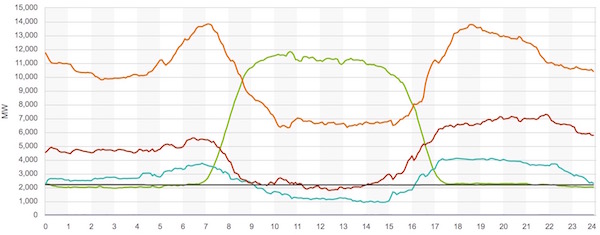
Power Supply on February 7, 2019
Cutting to the chase, the chart below shows the emissions rate for each quarter of 2018, measured in pounds of CO2 for each megawatt-hour of energy generated (source). As you probably guessed from the four sample days we looked at, midday is the best charging time throughout the year. Keep in mind that the low-emission window is shorter in fall and winter, more like 10am-3pm than 9am-4pm. Spring (red) has the lowest emissions overall, followed by winter (blue) because of lower midday demand. Fall’s emissions (purple) are worst, but about the same as summer (green) midday.
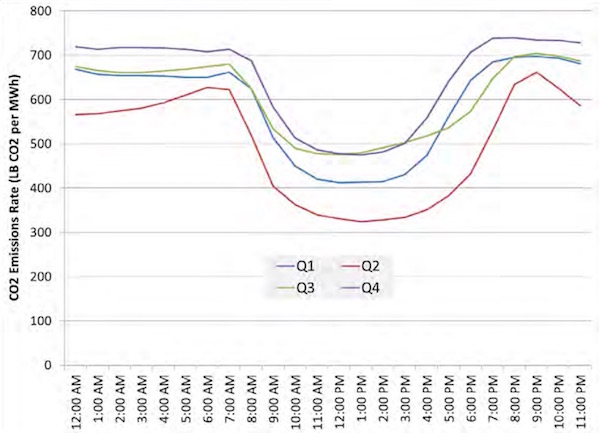
Do you see anything else interesting in these charts? I was surprised by the big seasonal difference in renewable supply (that wave-like graph near the beginning). How will we get clean year-round electricity, especially as we move our heating to electric power? I was also surprised by the shape of the demand curve. I had expected 2am demand to be much less than peak demand, but it’s two-thirds of peak. What are we doing at 2am to use so much power? Any other thoughts or observations on these charts?
Now that you understand all this (right?), you might be interested in an even more accurate way to determine the best time to charge your EV. Instead of looking at the emissions that are on the grid at a given time, you look at the emissions that would be added to the grid if you were to plug in your car. These are called “marginal emissions.” They sound a bit finicky, but they reflect how the grid actually works, so it’s important to use them for policies or technology that would impact electricity demand at scale. Stay tuned to learn more. In the meantime, consider midday charging!
Notes and References
0. You may be wondering what CAISO is. It stands for California ISO (not helpful), which stands for California Independent System Operator (also not helpful). More helpful: It is a non-profit organization that matches supply and demand of our electric power, and generally manages reliability of about 80% of California’s power grid. The information in this blog post pertains only to the grid managed by CAISO. Other electric markets will have different power mixes. You can find a map of them here.
1. The y-axis in this figure is mis-labeled, and should say TWh (terawatt-hours), not megawatts. A figure of 5 terawatt-hours of energy, measured over a period of 30 days (720 hours) represents an average power of about 7 gigawatts.
2. Does it seem counter-intuitive that we get more wind in spring and summer? In fact, California does have more wind in winter, particularly in the Sierras. But that’s not where we build our wind farms, due to extreme winds, icing, and general inaccessibility. We put them in “wind corridors” that are more accessible (e.g., near highways) and less subject to extremes. And those corridors happen to experience more wind in spring and summer. You can find more information here. Thank you to Michael Nyberg of the CEC for this pointer!
3. The days chosen are all mid-season weekdays: May 7, 2018 (spring), August 7, 2018 (summer), November 7, 2018 (fall), February 7, 2019 (winter). There is some variation within the seasons, but these days turn out to be largely representative except that the fall day was windier than typical.
Current Climate Data (March/April 2019)
Global impacts, US impacts, CO2 metric, Climate dashboard (updated annually)
Comment Guidelines
I hope that your contributions will be an important part of this blog. To keep the discussion productive, please adhere to these guidelines, or your comment may be moderated:
- Avoid disrespectful, disparaging, snide, angry, or ad hominem comments.
- Stay fact-based, and provide references (esp links) as helpful.
- Stay on topic.
- In general, maintain this as a welcoming space for all readers.


