Let’s start by taking a look at the whole state. Here is where California got its electricity in 2017. (All charts are from 2017 unless otherwise noted.)
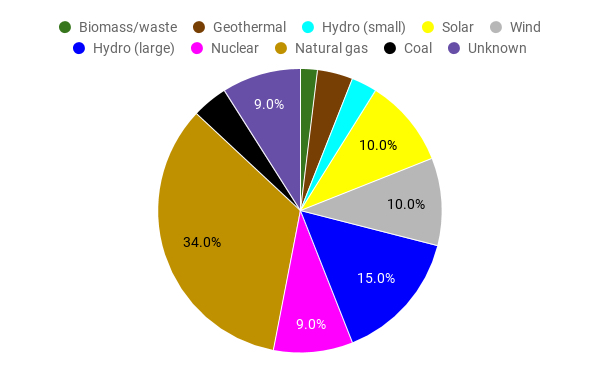
You can read this chart like a clock, starting at the top. Going clockwise, the first five “pieces” (green, brown, light blue, yellow, and gray) show renewable sources. For example, the yellow slice indicates that 10% of the state’s electricity came from solar power. California’s goal is for this renewables section to be 60% by 2030. (1)
Then come two non-renewable but still carbon-free power sources: large hydro in blue and nuclear in pink. (2) Finally, wrapping the rest of the way around the “clock”, we see carbon-intensive natural gas (a big tan section) and coal (black), plus unknown sources (purple). (3)
What do we learn from this? For one thing, California’s electricity is 53% carbon-free. (4) Yay! We still use a lot of natural gas, which we’ve learned is not much better than coal. And we don’t have enough renewables. But it’s a great start.
In our area, we are even luckier. Our electricity content is incredible, 100% carbon-free or nearly so. (PCE has a carbon-free option that many households and cities take advantage of (5)).
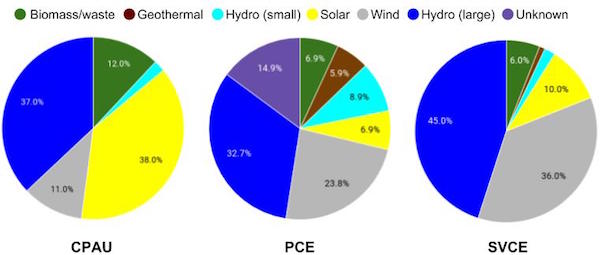
CPAU: City of Palo Alto Utilities, PCE: Peninsula Clean Energy for San Mateo County, SVCE: Silicon Valley Clean Energy for much of Santa Clara County
Palo Alto currently has considerably more solar capability than the other two local utilities, but PCE and SVCE both have large solar farms coming on board.
Our local experience makes it hard to imagine who is using all that natural gas in California. Smaller, local utilities like ours have been able to move quickly to adopt renewables and large hydro. The large, often privately-owned utilities have moved more slowly. Let’s consider the four largest of these:
- Pacific Gas & Electric (PG&E): serves much of northern and central California
- Southern California Edison (SCE): serves much of southern California
- Los Angeles Department of Water & Power (LADWP): serves much of the LA area
- San Diego Gas & Electric (SDG&E): serves the south-western corner of California
Can you guess which mix belongs to which utility? (In the case where a utility offers more than one option, such as SCE and SDG&E, the default is shown.)
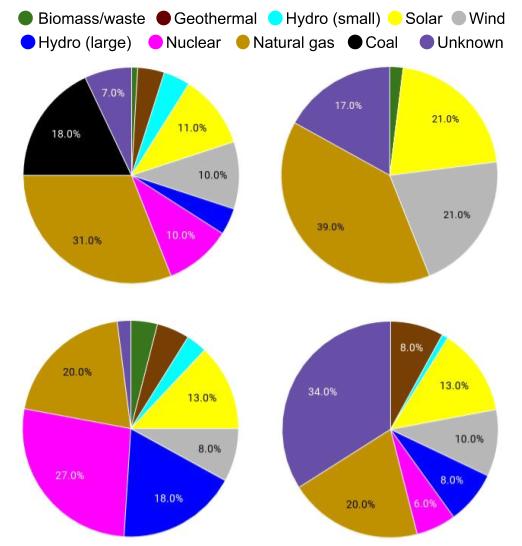
To help you out, take a look at this easy-to-read map of California's power plants. Where is the nuclear facility? Where do we have more hydro power? Which utilities will find it cheaper to use these? The utility in the lower-left has an impressive 78% carbon-free portfolio. Which one is it? (And what do you think will happen when the Diablo Canyon nuclear plant shuts down in 2025?) The utility in the upper right has an impressive 44% renewables. Which is it? (The answers are in footnote 6.)
How have our electricity mixes changed over time? Are they emitting less carbon each year? Take a look at the chart below.
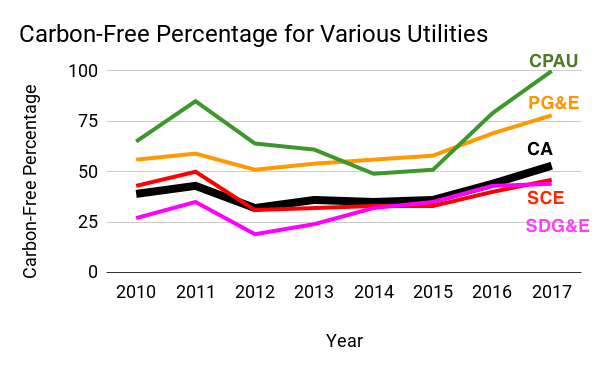
There is some gradual improvement, but we took a pretty big hit around 2012. What happened in 2012 and, at least for Palo Alto, 2013-2015 to hurt our carbon-free efforts? How did we bounce back? (The answer is in footnote 7.)
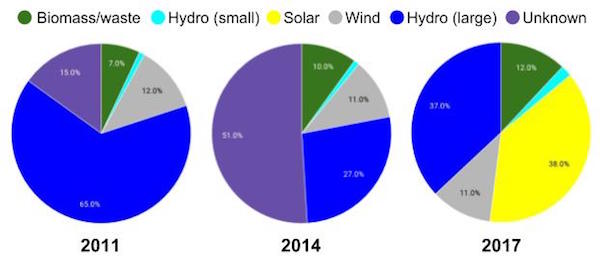
Here is Palo Alto in a wet year just before the drought (2011), in a dry year in the middle of the drought (2014), and in a wet year just after the drought (2017). How did the city adjust its portfolio? Will it do better in the next dry year? What can still be improved?
Let’s see how the whole state’s electricity evolved during that same time period:
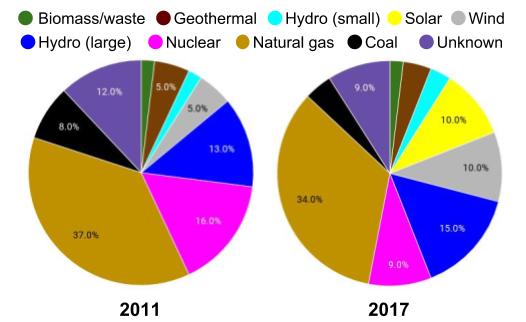
You can see the improvement in carbon-free electricity from 43% to 53% despite the loss of half of our nuclear power, as solar and wind came aboard. These state-wide changes have led to much lower emissions from the electricity sector. Our electricity emissions decreased by about 25% during this period, and are now just 62% of what they were in 1990. Importantly, this greener electric power gives us more options for moving away from natural gas in other areas like transportation.
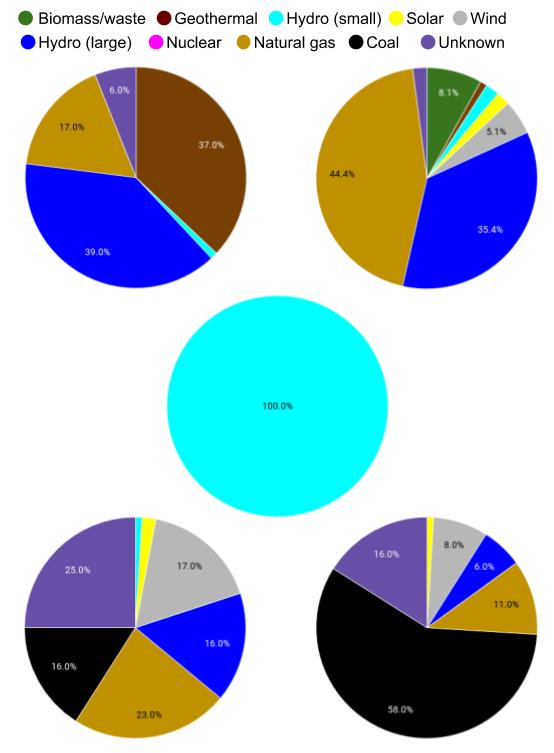
To wrap up this blog, I’ll end with one last mix-and-match. See if you can match the power content charts below to the following cities: Healdsburg (in Sonoma County), Modesto, Sacramento, Weaverville (near the Trinity Alps), and Yreka (way up north). Use what you know about where the cities are and what facilities may be nearby. How do you feel about our state capital’s electricity mix? (The answer is in footnote 8.)
Green electricity is critical to our effort to lower emissions, and utilities like our own local options are showing the state and our country how to do it. The next few blog posts will talk about how they are so successful, and what challenges and opportunities they see in this fast-changing market.
P.S. If you would like to be notified when new posts come out on this blog, visit the New Shade of Green page and find the “Follow this blog” link near the top.
Notes and References
1. Technically, the “60% renewables” goal is measured based on electricity recorded by utilities as “retail sales” to homes, industry, etc, while the power content for California shown here is based on all electricity generated at the point of production. The metrics can differ by more than 8%. Some electricity is lost in distribution and transmission. And there are a few uses that don’t count as “retail sales”, like power station service, pumped hydro storage, etc. Thank you to Michael Nyberg of the California Energy Commission for his very lucid explanation about this difference, and his careful reading of this blog post! The individual utility charts shown later reflect only retail sales, so more closely reflect the metrics for renewables.
2. California doesn’t consider large hydro to be “renewable” because of its impacts on fisheries and downstream water flow. Nuclear power has similar environmental issues with the waste that it generates.
3. “Unknown” energy is the amount of energy not specifically claimed by a utility under the Power Source Disclosure Program. This includes spot market purchases, wholesale energy purchases, and purchases from pools of electricity where the original source of fuel can no longer be determined. It can also include "null energy," energy from a certified renewable facility that has been separated from its renewable attributes (Renewable Energy Credits, or RECs) and sold separately.
4. The term "carbon-free" is a simplification, because developing and maintaining these plants results in emissions, and some of the auxiliary infrastructure needed (e.g., power storage) can as well. Starting in 2020, utilities will be reporting emissions, which will help to quantify this. Thank you to commenter Max Hauser for this footnote.
5. PCE provides two options to all customers. The one shown in this graphic is ECOPlus, which is generally the default. Their 100% renewable ECO100 electricity is available to all residents for just a few dollars more per month for most homes. ECO100 is used by nearly all city governments in San Mateo County, and thousands of homes have opted into using it. The city of Portola Valley chose it as the default for its residents.
6. The upper row has Los Angeles Department of Water and Power on the left and San Diego Gas and Electric on the right. The lower row has Pacific Gas and Electric on the left, and Southern California Edison on the right. PG&E has an impressive 78% carbon-free mix, but it will be interesting to see how they manage the closure of our one remaining nuclear reactor. Will they switch to natural gas or to renewables?
7. Two things happened in 2012 to hurt our carbon-free efforts. The first was that the San Onofre Nuclear Generating Station was permanently closed due to concerns over leaking steam generator tubes. This impacted utilities across the state, particularly in southern California (see SCE and SDG&E). In addition, California began an extended drought during this period, which hurt hydropower production. Palo Alto had a very large dependency on hydro, and was forced to purchase carbon-intensive electricity off the grid to make up for the deficit over the next 3-4 years. As a result of the loss of nuclear and hydroelectric power, the state’s natural gas usage increased by 33% from 2011-2012. The utilities recovered by diversifying their electricity sources, over time using cleaner sources.
8. In the top-left is Healdsburg, which has the world’s largest geothermal area, The Geysers. In the top-right is Sacramento, which is woefully dependent on natural-gas. In the center is Weaverville, a small community with large amounts of hydropower from the nearby Trinity Alps. The bottom left is Modesto. And the bottom right is Yreka, supplied by a utility called PacifiCorp. (I am not entirely sure what they mean by their slogan “A cleaner energy future starts now”. They are free to start any time…)
9. The California Energy Commission provides a good summary of our state’s electric power generation for each year.
Comment Guidelines
I hope that your contributions will be an important part of this blog. To keep the discussion productive, please adhere to these guidelines, or your comment may be moderated:
- Avoid disrespectful, disparaging, snide, angry, or ad hominem comments.
- Stay fact-based, and provide references (esp links) as helpful.
- Stay on topic.
- In general, maintain this as a welcoming space for all readers.


